
 en-US
en-US 

 Telegram
 WeChat


The hourly chart of gold price shows a double top pattern, suggesting that it is a good time to sell at a high price.
"Gold Price Forms Double Top on Hourly Chart—Sell on Strength"
Completed: 23/9/2026 11:13
Yesterday, as expected, gold prices tested the 4,310 level, with spot gold briefly dipping to 4,291.58 USD. On the hourly chart, gold subsequently rebounded sharply, forming a strong bullish "head and shoulders" breakout pattern. Following this, prices continued rising, peaking at 4,371.11 USD toward the end of New York trading session before consolidating at higher levels. This morning, after reaching a high of 4,369.37 USD, prices reversed sharply, forming another head-and-shoulders bearish pattern, temporarily falling to 4,333.95 USD.
On the daily chart, gold tested below the 50SMA (currently around 4,307) but closed strongly higher yesterday, suggesting that the market may have completed its bottom test and is now likely to challenge the resistance at the 20SMA (currently around 4,378). However, the hourly chart clearly shows a double top forming near 4,370 USD, and the price has since broken below 4,360 USD—consistent with expectations of a peak today. Therefore, selling on strength remains the primary strategy. Moreover, the gap between the 20SMA and 50SMA continues to narrow, signaling an imminent breakout. Given the prevailing expectation of rising U.S. interest rates, the risk of a gold rebound is relatively high (though not entirely ruled out), meaning short positions can be held, while long positions are more vulnerable.
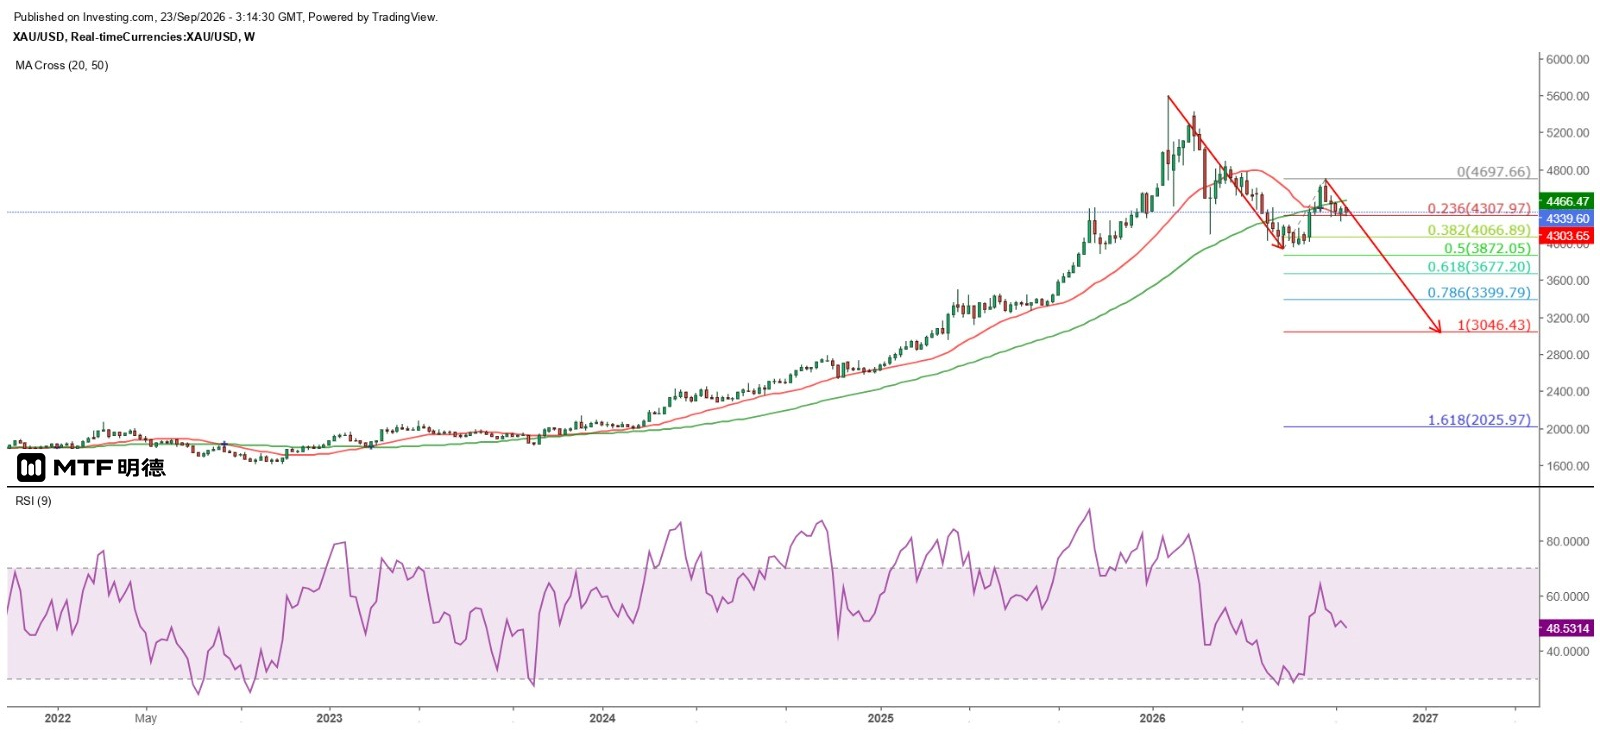
Looking at the broader weekly chart, investors will notice that gold has now fallen below the 50SMA (around 4,466) for the second time since early June this year. The duration spent below this moving average is currently the longest since June 2022, when gold last broke below it. That decline began in March 2022 at 2,070.29 USD and didn't reverse until late September 2022, when it reached 1,614.35 USD before launching a recovery. In terms of price, the maximum drop was nearly 413 USD, or about 22%. Applying this historical pattern to the current trend, starting from the August peak of 4,697.66 USD, gold could fall to 4,285 USD—already meeting the threshold. A further 22% decline would bring prices down to 3,664 USD, which coincides precisely with the 270-degree vertical angle of Gann's square, indicating substantial room for further downside movement.
The above information is for reference only and does not constitute investment advice.


