
 en-US
en-US 

 Telegram
 WeChat


The target for the double top decline in gold prices is $4,102.
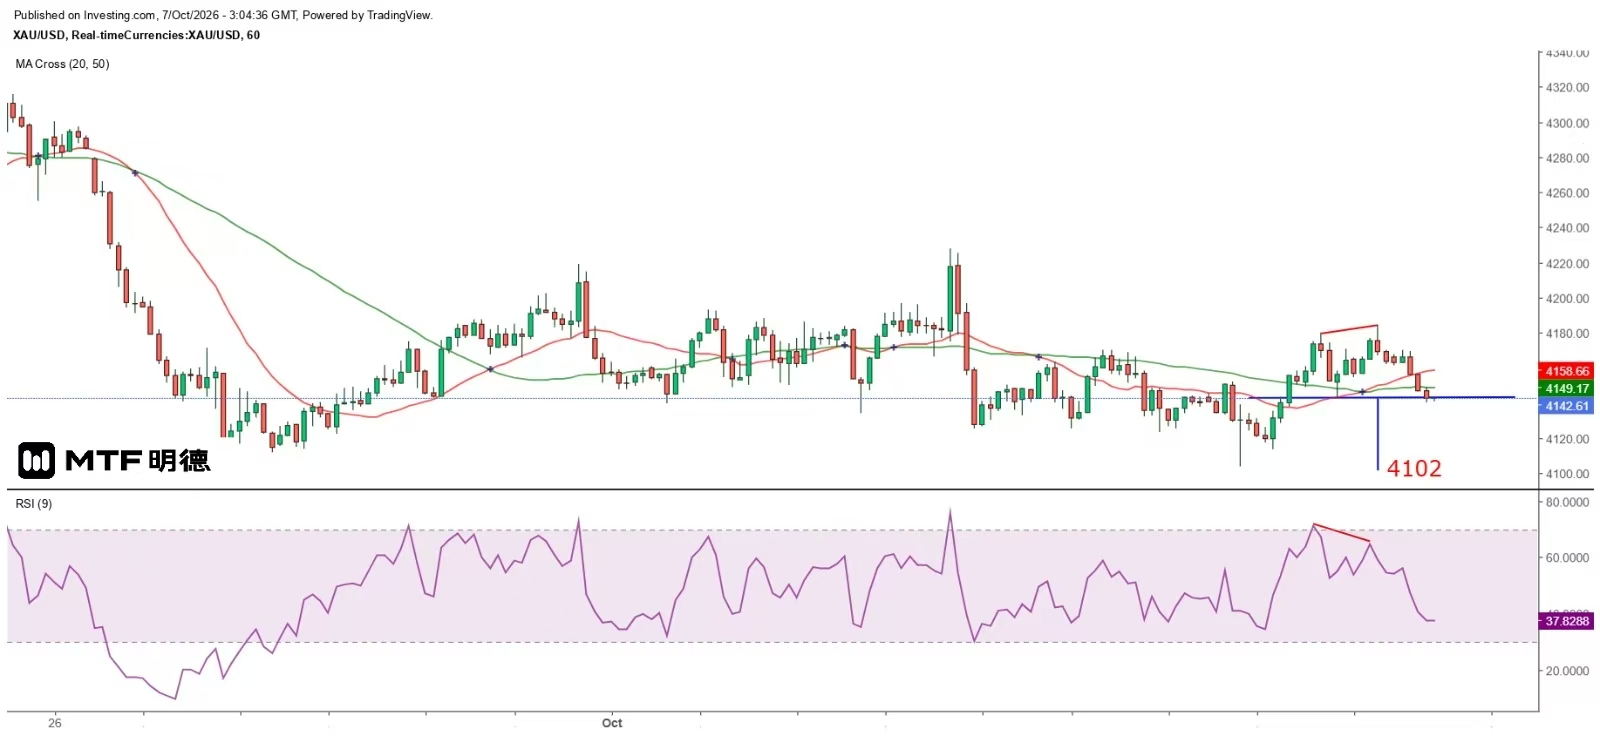
Gold Market Analysis: "Double Top Forming, Target at $4,102" – July 10, 2026, 11:06 AM
Yesterday, during the early Asian session, spot gold prices dipped as low as $4,103.7 before rebounding. On the hourly chart, gold peaked at $4,179.72 and then $4,184.48 during the initial and closing phases of the New York session, respectively. Following a bearish divergence with the 9RSI indicator, prices subsequently declined. This morning, gold fell to $4,140.36 before recovering slightly. Although yesterday's daily range exceeded $80, the maximum gain was less than $45, indicating that current price movements are characterized by wide fluctuations—effectively eliminating speculative traders who lack sufficient capital or rely heavily on leverage.
On the daily chart, it is evident that after a large bearish candlestick on September 28, gold has been consolidating in a sideways pattern near lower levels. Yesterday’s single-day reversal did not form a definitive trend reversal signal. A true upward shift would only be confirmed if gold breaks above $4,280.56 and closes above this level. Currently, the market remains in a consolidation phase. I believe this period is allowing gold to accumulate momentum ahead of a potential downward breakout. The more long positions (buying interest) built up now, the stronger the downward thrust will be once the break occurs (as stop-loss orders from longs increase selling pressure). Conversely, if short positions grow significantly, a subsequent upward breakout could accelerate gains. However, at present, the technical setup suggests a likely downward move.
Therefore, from a strategic standpoint, those bearish on gold should avoid placing large bets at this stage. Stop-loss orders must not be set too far out, as sharp volatility could trigger premature exits. Subsequent re-entry with reduced position sizes may then become necessary due to accumulated losses. For now, the key support level remains around $4,110, while resistance lies at $4,210. Short-term sellers should consider exiting when gold rises above $4,210. If a downward breakout occurs, gold is likely to test the $4,000 level. In the short term, the neckline of the double top formation at $4,143.59 provides a target for the measured decline, pointing toward $4,102.7.
The above information is for reference purposes only and does not constitute investment advice.


