
 en-US
en-US 

 Telegram
 WeChat


Gold prices are still fluctuating within a range for the time being.
Gold Market Analysis: "Short-Term Gold Remains in a Sideways Trading Range"
October 15, 2026, 11:15 AM (Completed)
U.S. September CPI data indicated rising inflation, triggering a sharp decline in gold prices. The latest figures showed that overall CPI rose 3.7% year-on-year in September, above the previous reading of 3.4% and market expectations of 3.6%. On a month-on-month basis, CPI increased by 0.6%, also exceeding both the prior figure of 0.4% and the expected 0.6%. Core CPI rose 2.6% annually, surpassing the previous 2.4% and forecasted 2.5%, while the monthly increase stood at 0.3%, matching the prior reading but still higher than the expected 0.2%.
Interest rate futures suggest that market expectations for a 25-basis-point rate hike by the end of this month have risen to 27.1%, while the probability of no change has slightly declined to 77.9%. Nevertheless, this still reflects a high likelihood that rates will remain unchanged this month. In my view, since the Federal Reserve signaled in its September economic outlook that another rate hike might occur later this year, it is unlikely to act prematurely this month. If a hike were implemented now, uncertainty would arise over whether another increase would follow in December, potentially destabilizing financial markets. By postponing any decision until December, the Fed could use its updated economic projections to clearly communicate committee members’ views on future interest rate trends.
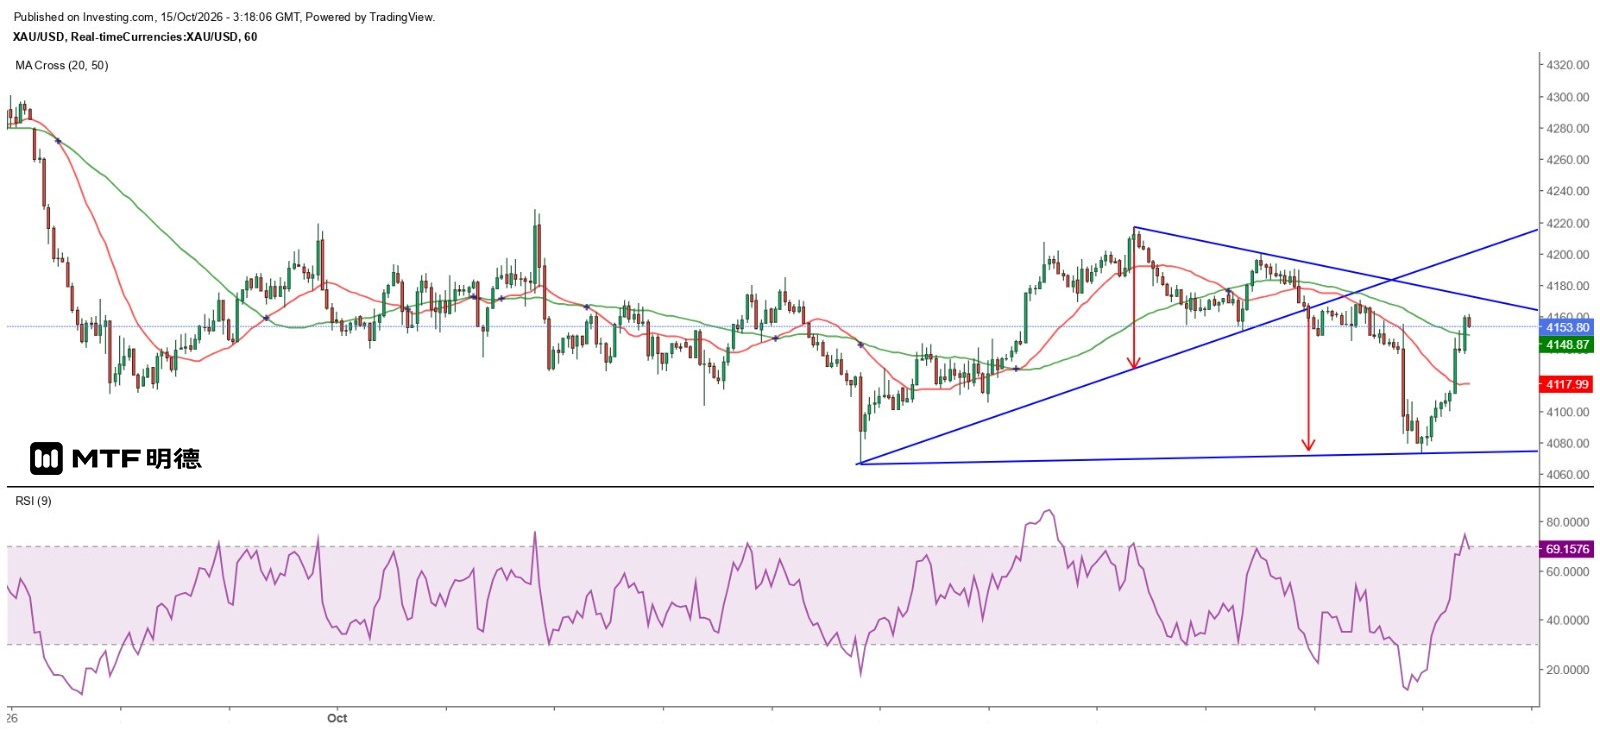
Gold prices dropped sharply following the inflation data, falling below $4,100 and touching a low of $4,073.51 before recovering. On the hourly chart, the RSI dipped as low as 11 before gradually regaining ground. This morning, Asian trading sessions fully recovered the losses from the inflation report, with gold briefly reaching a high of $4,161.81. Although gold broke down from the bullish flag pattern on the daily chart, it has formed a double bottom on the hourly timeframe. While gold has not yet launched a sustained upward move, this merely indicates that it remains within the sideways consolidation range established after the steep drop on September 25. For the near term, $4,110 remains a key support level, while resistance lies between $4,210 and $4,230. Optimistically, gold may hold above $4,110 throughout the day.
The above information is for reference only and does not constitute investment advice.


