
 en-US


 Telegram
 WeChat


Gold Prices Expected to Be Constrained by the 50-Day Moving Average in the Short Term
Gold Market Analysis: Gold Prices Expected to Be Constrained by the 50-Day Moving Average in the Short Term | 9/11/2026 11:01 Finalized
U.S. nonfarm payrolls for October came in stronger than expected, with 165,000 new jobs added, well above the market forecast of around 60,000 to 70,000. September’s job gains were also revised up from 29,000 to 60,000, while the unemployment rate in October fell by 0.1 percentage points to 4.1%. Year-on-year average hourly earnings growth edged down slightly from 3.2% to 3.1%. The employment report showed that professional and business services added 70,000 jobs, far above the 12-month average of 15,000 per month and the strongest month since July 2022, making it the largest contributor to nonfarm payrolls. In addition, healthcare added about 42,000 jobs, also above the 12-month average of around 31,000, marking the strongest month in six months. Transportation and warehousing added 25,000 jobs, while manufacturing added 19,000, both contributing to last month’s relatively strong employment performance.
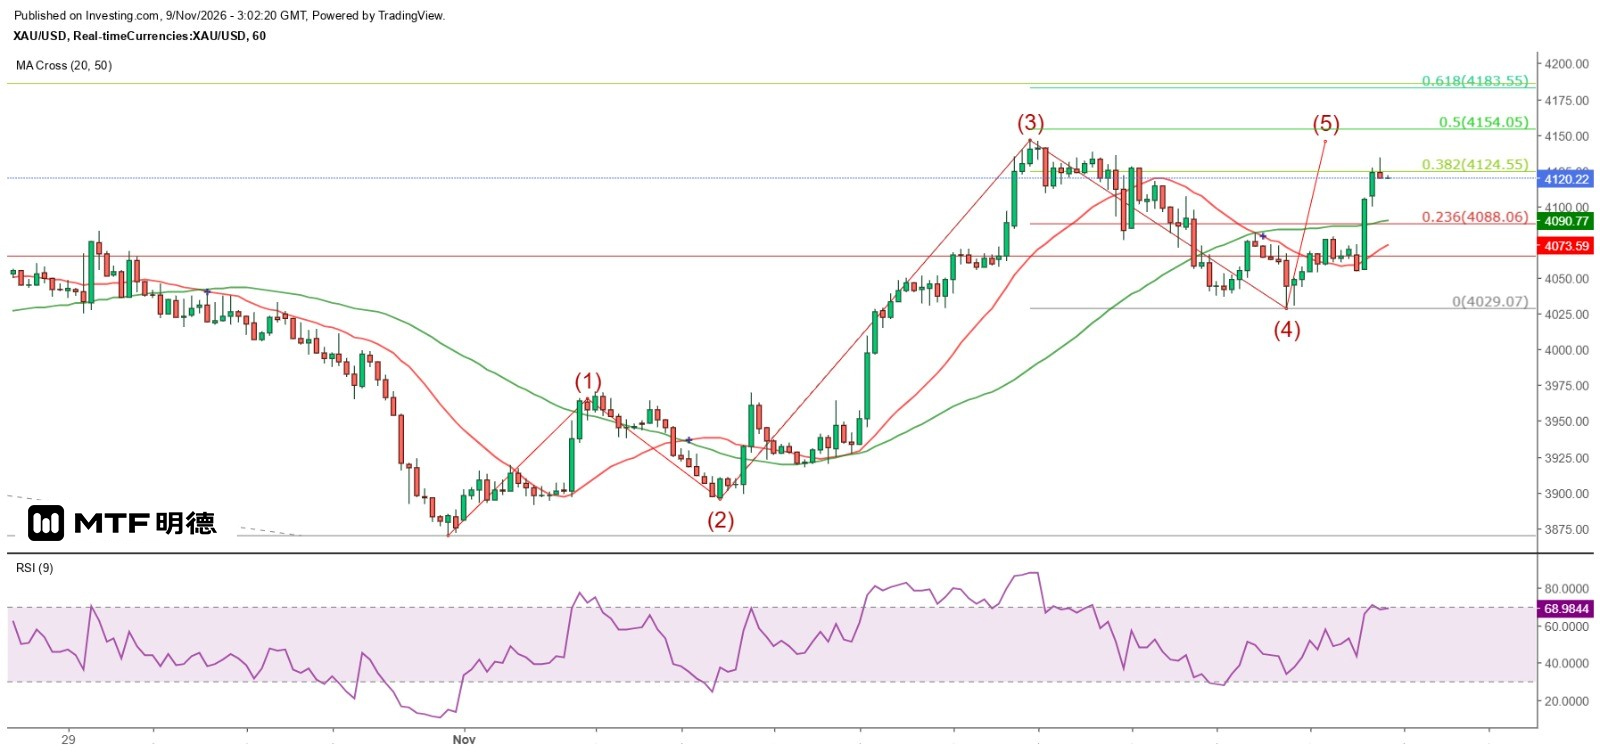
The data once again raised market expectations for a Federal Reserve rate hike in December, with interest rate futures pricing in an 80.5% probability of a rate increase. Gold prices initially plunged sharply on the data, with spot gold dipping to $4,029. However, as seen on the hourly chart, gold rebounded on the 30-minute chart to close at $4,044.29 and reached a high of $4,078.58 in the late New York session. This morning, after pulling back to $4,054.40, gold surged sharply and once again broke above the $4,100 level, with a temporary high of $4,134.19.
As seen on the hourly chart, gold has followed last week’s expectation of entering a Wave 4 corrective move and is now in Wave 5, approaching the Wave 3 high. At present, it remains unclear whether gold can break above the Wave 3 high, so the Wave 3 high of $4,146.92 can be taken as the first upside resistance. If it breaks above that level and the cumulative gain equals 0.618 times Wave 3, gold could target $4,183.55. On the daily chart, the 50-day simple moving average (SMA) is currently around $4,191. Given its downward trend, gold is highly likely to touch this line in the short term, and it is expected to act as short-term resistance. After consolidating between the daily 20-day SMA (currently around $4,064) and the 50-day SMA (currently around $4,191), gold is expected to climb further, with $4,283.92 viewed as the major resistance level.
The above content is for reference only and does not constitute investment advice.