
 en-US
en-US 

 Telegram
 WeChat

2026-09-18
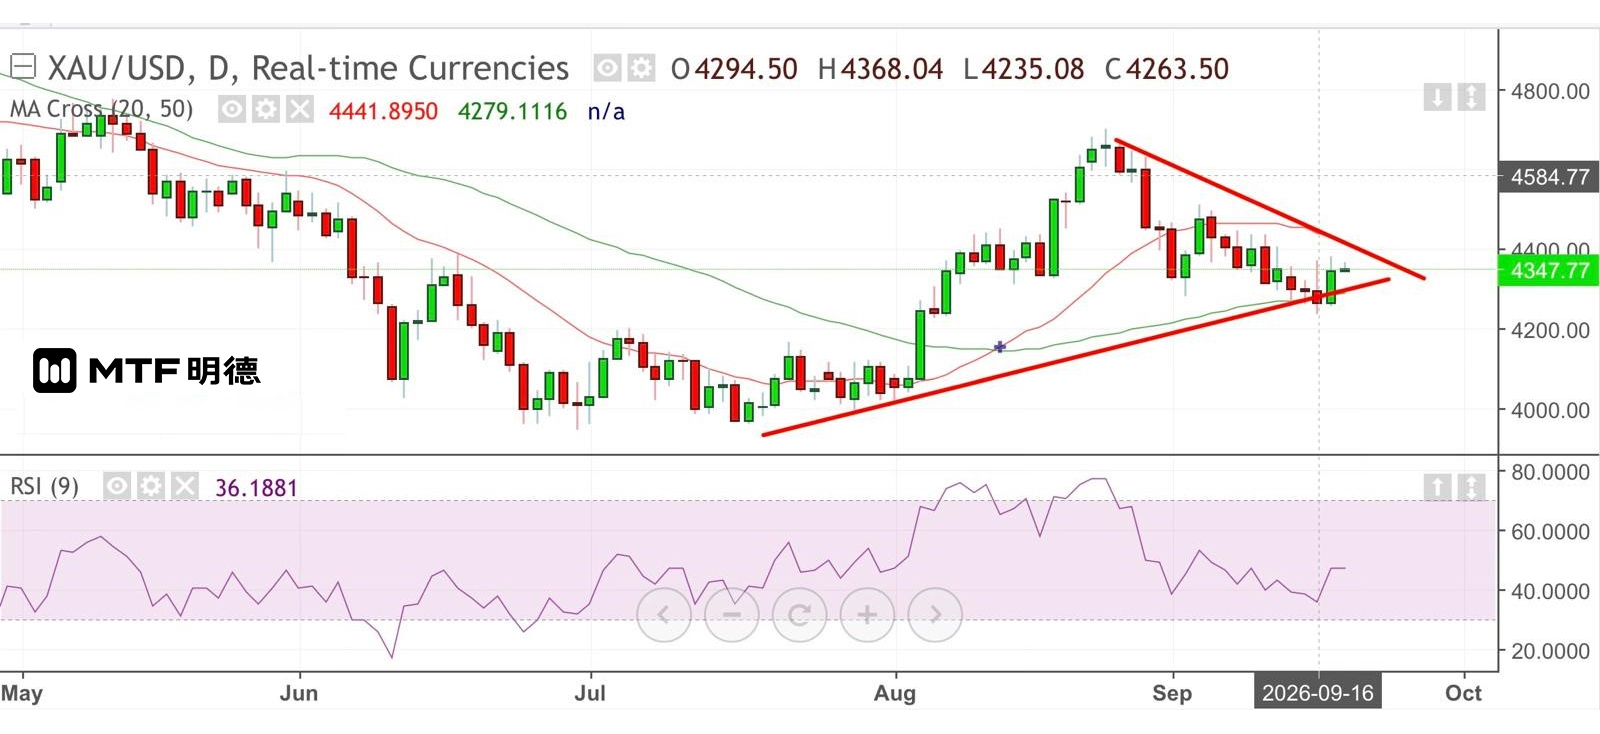
"Strong Gold Prices Signal an Upcoming Sharp Drop" – Completed on 18/09/2026 at 10:07 Following the Federal Reserve's unanimous decision to raise interest rates by 0.25%, gold prices initially plunged sharply but then rebounded steadily, gaining over $100 yesterday—significantly outperforming other major non-U.S. currencies. While higher U.S. interest rates are theoretically extremely negative for gold, why has this time been so unusual? Why hasn't gold fallen with the rate hike, instead recovering strongly after a sharp drop? I believe this is a precursor to a significant decline in gold prices. First, the Fed’s announcement of a rate hike—and its indication that another 0.25% increase may occur later this year—likely attracted increased selling pressure on gold. However, gold had already broken below the 50-period simple moving average (SMA) on the daily chart (currently around $4,288). Moreover, since the expected next hike is scheduled for December, this timing actually creates a potential catalyst for a rebound. Therefore, I have long anticipated that gold would remain volatile around the 50-SMA and 20-SMA levels in the short term. On the other hand, the Fed’s shift toward tightening has led to rising real interest rates. Statistics show that when the 10-year real interest rate exceeds 1.5%, or even remains above 2%, gold prices tend to face clear downward pressure. Currently, the U.S. 10-year TIPS yield has surpassed 2.6%, suggesting that a new wave of decline in gold prices is likely imminent. Investors should watch closely: if gold forms a consolidation zone between the 50-SMA and 20-SMA on the daily chart during the fourth quarter, there will be a high probability of a breakdown into 2027—or even after the U.S. midterm elections. A fall below $4,210 would not only breach the neckline of a head-and-shoulders pattern on the hourly chart but also signal a test of the $3,900 level. In the short term, gold is expected to remain above $4,310, but the resistance zone between $4,360 and $4,380 is critical. Even if this range is breached, further upside will likely be capped at $4,410. Overall, I anticipate greater volatility and sideways movement in the near term. The above information is for reference only and does not constitute investment advice.
2026-09-17
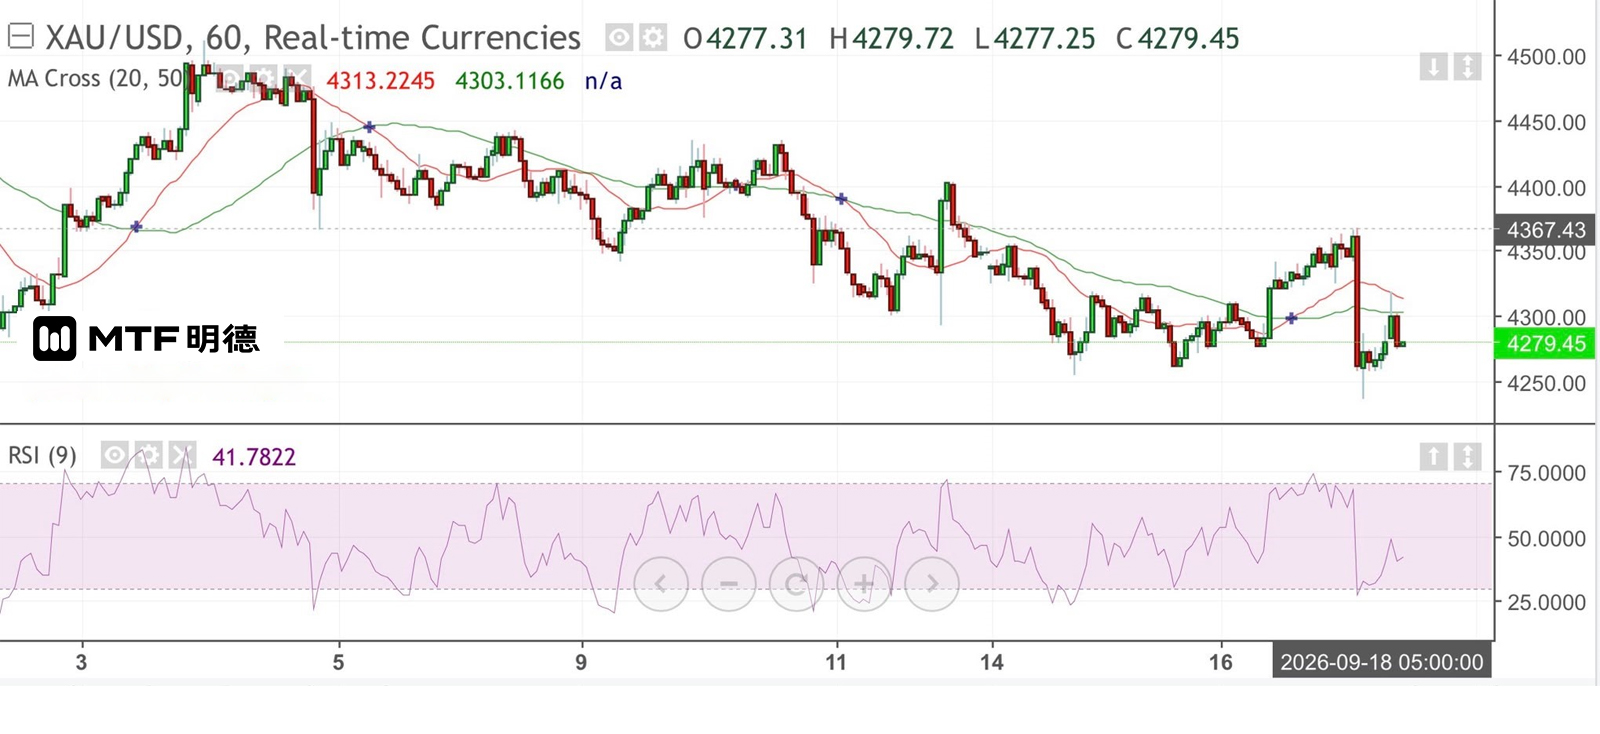
Gold Price Tests 4210 Again, Risks Rising Completed on 17/09/2026 at 10:59 As expected, the U.S. Federal Reserve announced a 0.25% rate hike following its policy meeting, raising the target range for the federal funds rate to 3.75–4%. All 12 voting members supported the decision. In its statement, the Fed noted that economic activity continued to expand steadily, domestic spending remained resilient, productivity and capital investment were strong, employment and labor market conditions advanced in tandem, and the unemployment rate showed little change—though inflation remained elevated. The current tightening is expected to help bring inflation back to the 2% target more quickly. The committee remains committed to price stability and will continue maintaining ample reserves in the banking system. In its latest economic projections, the Fed raised the median estimate for the key interest rate this year from 3.8% in June to 4.1%, indicating another potential rate increase within the year. Additionally, the median forecast for PCE inflation was revised upward from 3.6% in June to 3.7%, while core PCE inflation rose from 3.3% to 3.4%. The central bank now expects inflation to return to the 2% target only by 2029. Although the outcome aligned with market expectations, the unanimous approval of the rate hike and the hawkish forward guidance led to a sharp drop in gold prices immediately after the Fed announcement. Spot gold briefly dipped to $4,235.4 before recovering. This morning, it peaked at $4,318 but faced resistance at the 20-period SMA (currently around $4,316) on the hourly chart, followed by another decline. While Fed officials still see room for one more rate hike this year, the mid-term elections in early November may limit the likelihood of a move by late October. If a hike occurs in December, markets will have sufficient time to adjust. Until then, gold prices are likely to fluctuate based on data releases. A break above $4,410 seems unlikely at present; instead, the market appears more inclined to test the $4,210 support level. Meanwhile, $4,310 is likely to act as a pivot point and major resistance for medium- to short-term trends. Today’s trading is expected to range between $4,260 and $4,310. Should prices retest $4,235, a double-bottom rebound would be highly probable. In the near term, technical factors suggest that gold will likely trade in a volatile, sideways pattern. The above information is for reference only and does not constitute investment advice.
2026-09-16
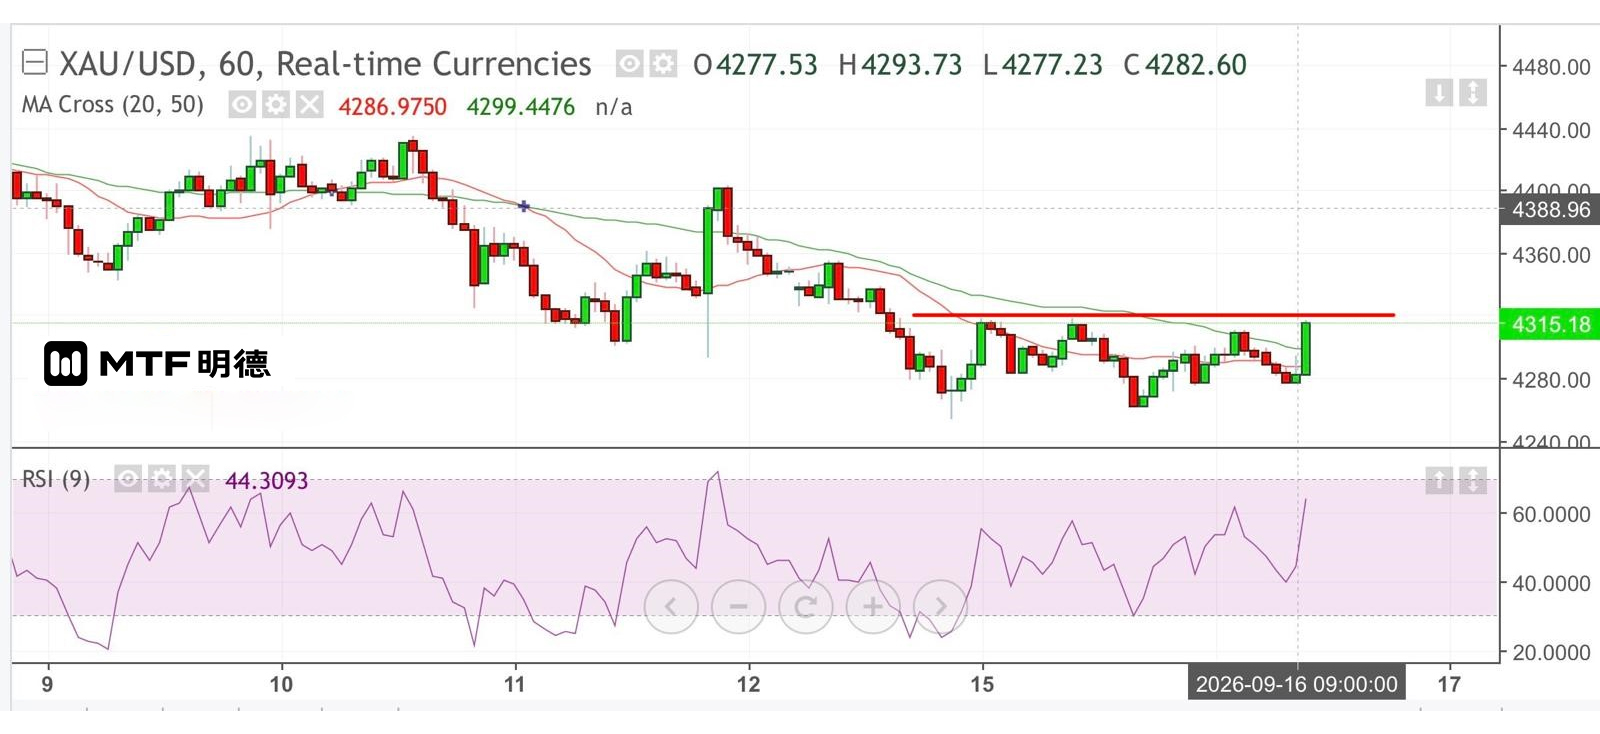
Gold price expected to fluctuate above $4,310 intraday September 16, 2026, 10:47 AM The market expects a 25-basis-point rate hike tonight with over 90% probability. If implemented, this would mark the first increase since 2023, continuing pressure on gold prices. From the hourly chart, gold remains within a downward trend initiated on September 3 from the $4,510 level. After breaking below the 50-period SMA (currently around $4,298.29) last Friday, gold has shown clear weakness in challenging that moving average, while resistance is gradually forming near $4,310. Currently, the market has largely priced in a 25-basis-point Fed tightening. Future movements will depend on the Fed’s outlook for the economy, inflation, and employment, as well as Chair Waller’s comments. However, if he continues to avoid expressing a clear stance, traders will likely focus on interpreting limited signals to position themselves accordingly. This morning, spot gold briefly dipped to $4,275 before recovering steadily and re-crossing above $4,310. Should gold clearly break above the horizontal resistance at $4,318 on the hourly chart, there is a high likelihood of testing the Gann 270-degree vertical angle at $4,410. The key factor will be whether the Fed adopts an aggressive hiking path following any rate increase. Otherwise, $4,210 could serve as strong support, while $4,410 may act as short-term resistance—potentially paving the way for another test of $4,510. For most of the day, gold is expected to trade above $4,310. The above information is for reference only and does not constitute investment advice.
2026-09-15
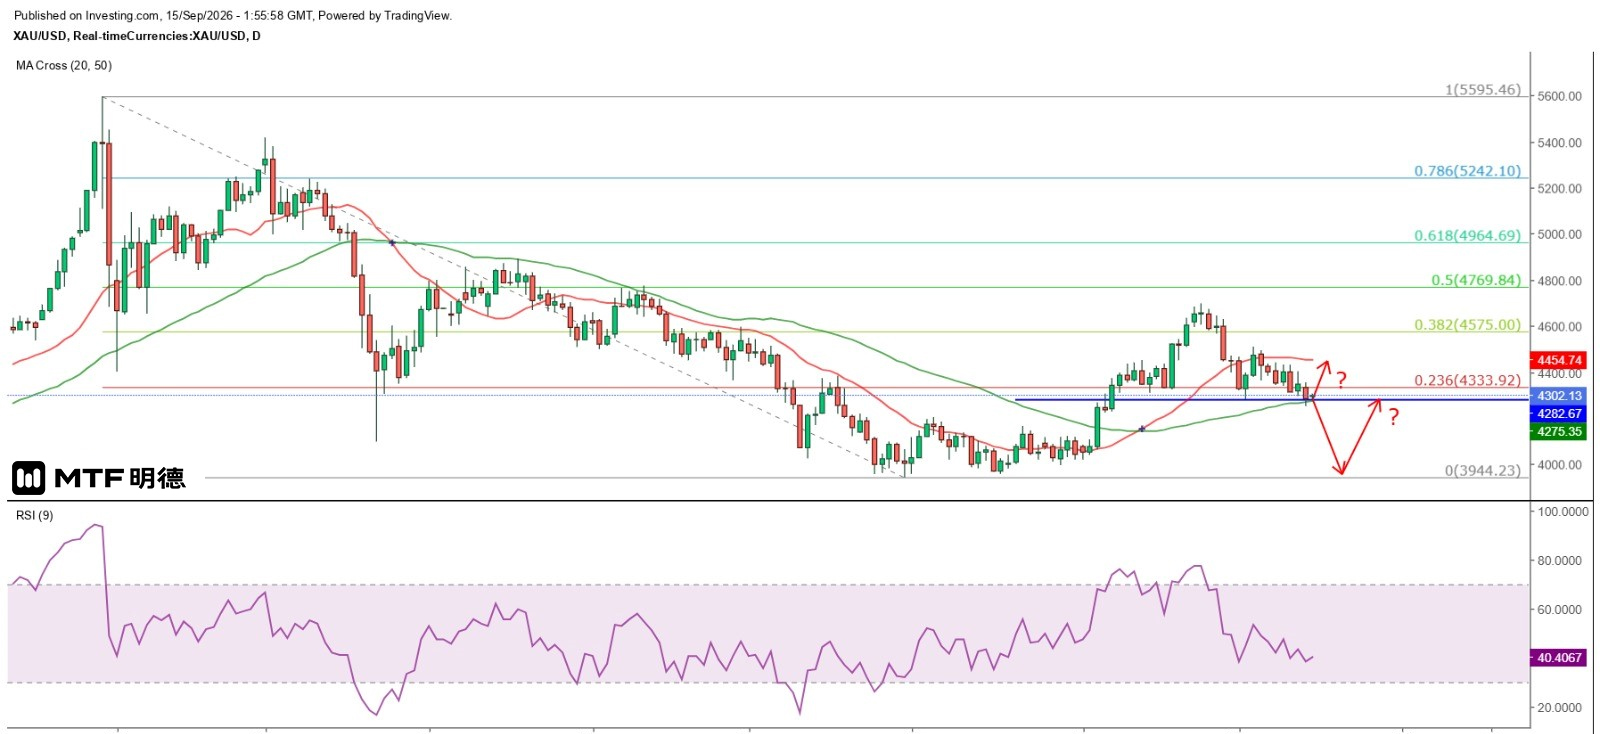
"Gold Price Expected to Fluctuate Above 50-Day Moving Average in the Short Term" – Completed on 15/9/2026 at 9:53 Ahead of the Federal Reserve's interest rate decision, gold prices continued to face pressure. Although spot gold rebounded early in Asian trading to around $4,355, it quickly encountered strong selling pressure and resumed its downward trend into the early New York session. The price sequentially lost key levels at $4,310 and $4,300, falling as low as $4,253.82 before launching a recovery wave. After London market close, gold briefly rose to $4,317.88 but then declined again, ultimately breaking below $4,300 by the end of the New York session. However, after today’s Asian open, gold regained above $4,300. Although it later dipped again, the lows did not fall below yesterday’s closing level in New York. On the 5-minute chart, gold formed a double bottom at $4,282 and $4,283. Although gold did not reach the Gann 180-degree angle at $4,210 yesterday, the daily decline was nearly $100, suggesting that the impact of this week’s Fed rate hike has already been fully priced in. If the Fed raises rates by 25 basis points at this meeting but signals caution in its post-meeting statement—such as indicating further hikes depend on ongoing developments, particularly the Middle East situation’s impact on oil prices—the likelihood of another rate increase in October remains low. Especially since the meeting occurs just one week ahead of the U.S. midterm elections, it is even less likely that the Fed would adjust rates during such a sensitive period. For the Fed to monitor the Middle East situation, key considerations include the outcome of the mid-term elections and Trump’s subsequent policy toward the region. $4,210 remains a strong support level for gold. Even if the Fed does raise rates, provided it maintains a cautious stance as expected, the chances of gold breaking below this level are slim, as investors always look forward. On the daily chart, gold briefly fell below the head-and-shoulders neckline at $4,282.71 and the 50-day SMA (currently around $4,275), but eventually closed back above the neckline. On an optimistic note, following the Fed’s rate decision, gold could trade within a range between the 50-day and 20-day SMAs (currently around $4,454). A more pessimistic view suggests that if the Fed announces a rate hike and gold breaks below the 50-day SMA, there is a high probability of forming a major double bottom near $4,000 or testing that level with a divergence against the RSI, followed by a strong rebound. However, it is unlikely that gold will break above the August 25 high of $4,697.66 in the fourth quarter. The above information is for reference only and does not constitute investment advice.
2026-09-14
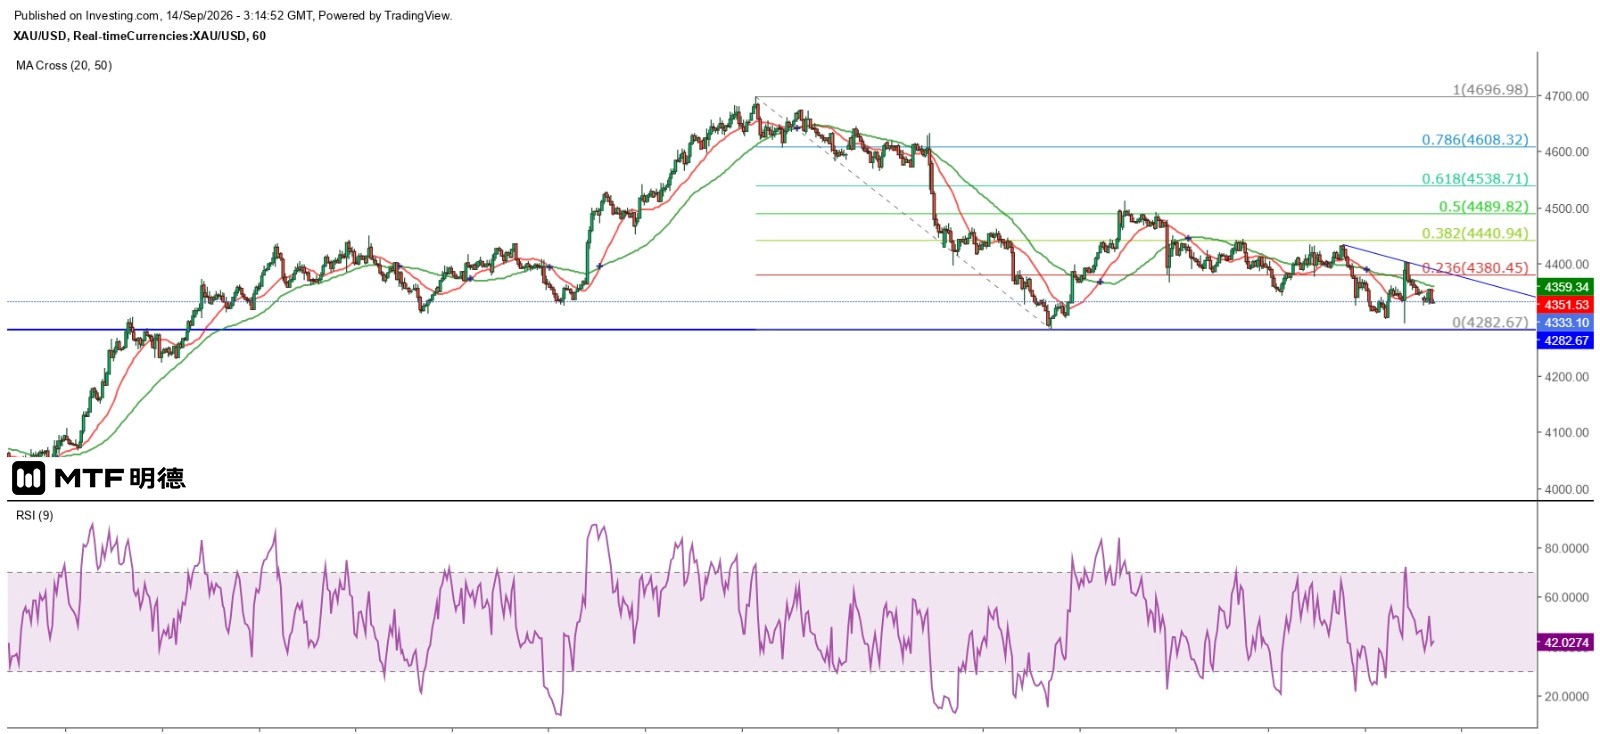
Gold Prices Expected to Remain Under Pressure This Week September 14, 2026, 11:11 AM The U.S. August CPI data indicated persistently high inflation, increasing pressure on the Federal Reserve to raise interest rates. According to CME's FedWatch tool, interest rate futures suggest an 86.7% probability that the Fed will hike rates by 25 basis points at this week’s policy meeting. Last week, apart from the Japanese yen, all major non-U.S. currencies weakened against the dollar. The New Zealand dollar fell 1.47% against the dollar—the worst performer—followed by the Swiss franc, with the dollar rising 1% against the CHF. The Australian dollar, the highest-yielding among major currencies, also declined 0.89% against the dollar. Following the release of the U.S. August CPI data last Friday, gold prices initially plunged to $4,292.35 but quickly rebounded on the hourly chart to $4,388.76, reaching a high of $4,402.56. However, prices subsequently retreated and closed in New York below $4,350. This morning, Asian markets opened lower with a gap down, testing levels around $4,325 before recovering slightly. Nevertheless, resistance remains near the 20-period SMA on the hourly chart (currently around $4,350), and a double-hourly reversal suggests a high likelihood of another short-term drop below $4,300. From a technical perspective, the hourly chart of spot gold has clearly formed a head-and-shoulders top pattern. Measured from its lowest point since August 7 at $4,282.67, a breakdown below this level would target approximately $3,868. In the short term, the key support is the Gann 225-degree angle at $4,310, which acts as the neckline. A break below this level would signal further downside toward the 180-degree angle at $4,210. If gold fails to launch a strong recovery and retest the 270-degree angle above $4,410, two scenarios are likely: first, gold will remain weak ahead of the Fed’s rate decision; second, if a rate hike occurs, the downward trend may extend into early next week. The current strategy remains focused on selling on strength, with the first major resistance at $4,360. The above information is for reference only and does not constitute investment advice.

2026-09-11
"Gold Price Struggles to Hold Above $4,310" – Completed on 11/9/2026 at 11:07 The U.S. August PPI indicates worsening inflation, and with crude oil rising above $100 per barrel, the overall CPI inflation rate in September is expected to climb further. However, as the Federal Reserve meets next week to decide on interest rates, we are currently in a blackout period during which Fed officials cannot publicly express their views. Given that leading indicators suggest deteriorating inflation, market focus has shifted beyond today’s release of the September CPI data. For gold prices, unless the CPI inflation rate shows a significant slowdown, the Gann 225-degree angle at $4,310 will face downward pressure. It's important to note that the relatively stronger support level lies at $4,210. Even if gold briefly tests above $4,310 today, it would be difficult to trigger a strong rebound. Personally, I expect gold to remain anchored around the $4,310 level before the U.S. releases its August CPI data, making a move above $4,360 unlikely. Taking the midpoint between these two levels as resistance, $4,335 represents a key resistance zone. A potential rebound may not occur until next Tuesday, but only if the Fed maintains current interest rates. Should the Fed announce an interest rate hike, gold could drop toward $4,210 before stabilizing temporarily. On the hourly chart, gold has approached the neckline of a head-and-shoulders top pattern, with two key levels at $4,311.26 and $4,282.67. If either of these levels breaks, the projected decline could range from $380 to over $400, meaning gold might fall below $3,900. In times of risk, opportunities also emerge. Strategically, $4,210 remains a strong support level; approaching this point, investors should consider building long positions while setting stop-loss orders. In the short term, selling is advisable when gold rebounds to $4,335–$4,350, with a stop-loss placed above $4,360. The target for such a trade would be $4,310. The above information is for reference only and does not constitute investment advice.
2026-09-10
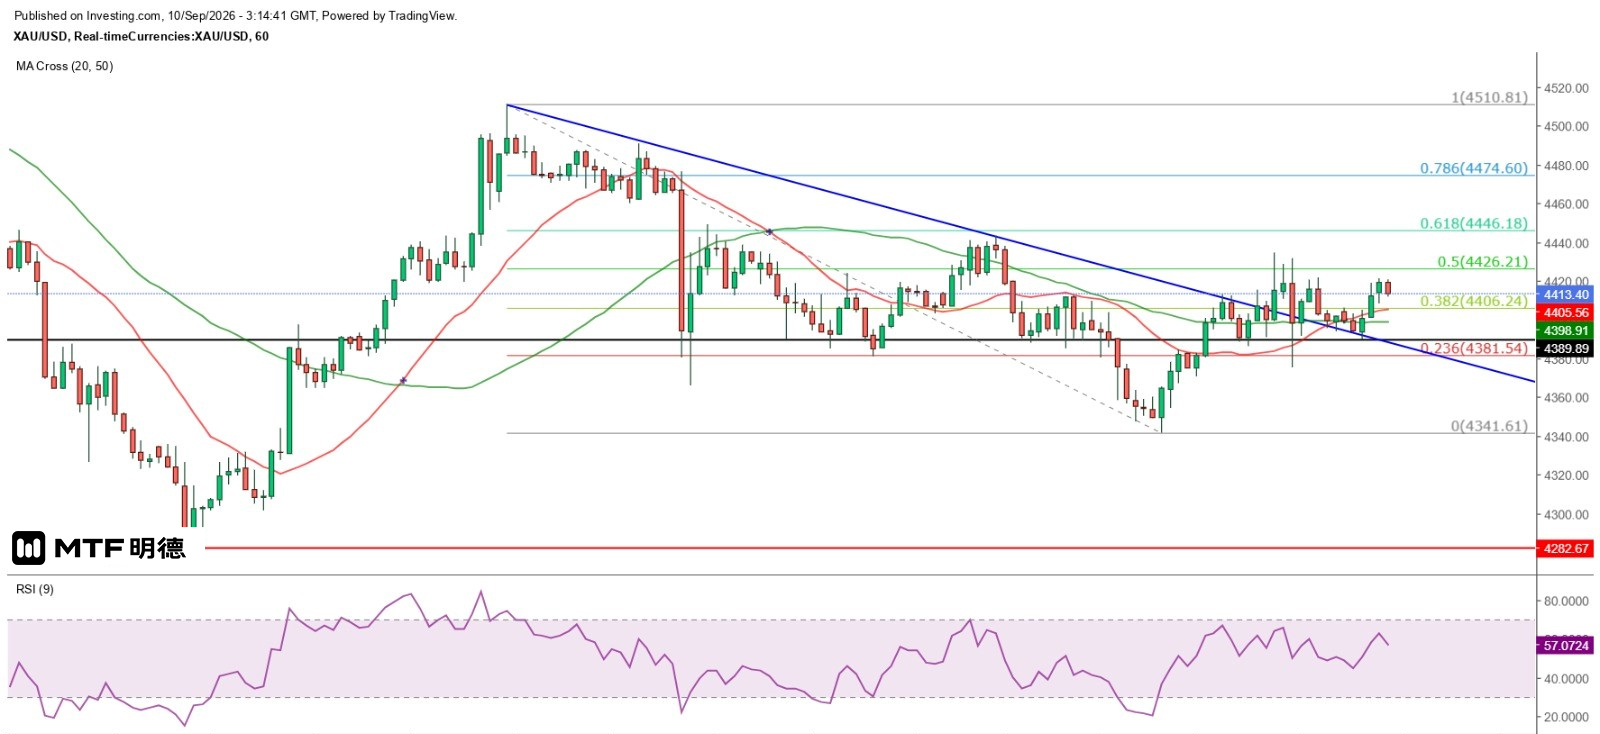
"Gold Price at 4390 Must Be Defended" – Completed on October 9, 2026, 11:12 AM Volatility in gold prices intensified ahead of the release of inflation data that could influence next week's Federal Reserve interest rate decision. After touching a low of $4,341.61 during yesterday’s Asian session, spot gold formed a rare bullish engulfing candlestick pattern on the hourly chart and subsequently surged higher, peaking at $4,434.23 early in New York trading. Before London market close, prices sharply declined to $4,375.29, and have since remained within this range, fluctuating throughout the morning. On the hourly chart, an unusual diamond-shaped formation has emerged—characterized by gradually expanding volatility followed by a gradual contraction—indicating intense battling between bulls and bears from 9 p.m. to 11 p.m. last night, which has now temporarily subsided. On the hourly chart, spot gold has broken above the upper boundary of its previous descending channel and is currently consolidating around $4,390 or above. Tonight, the U.S. will release August PPI data, a leading indicator of inflation. Since hitting a low of $74.24 on August 5, New York spot crude oil has steadily climbed to a high of $87.69 on August 20. Meanwhile, the U.S. dollar index dropped to 98.56 on August 20, down nearly 2.7% from its peak of 101.26 on July 28. Market expectations are for the overall PPI to rise 0.4% month-on-month (up from 0.1% in July), with year-on-year growth projected between 4.7% and 5.1% (previously 4.7%). Core PPI is expected to increase 0.3% month-on-month (from 0.2% in July) and 4.6% year-on-year (up from 4.2%), signaling a likely further deterioration in September’s CPI inflation (to be released in October). Therefore, even if tomorrow’s August CPI report does not show a significant acceleration, persistent inflation above target levels will continue to pressure the Fed into raising interest rates. The key question then becomes whether Wash and the FOMC committee will choose to implement monetary policy contrary to President Trump’s views just before the midterm elections. I emphasize that a rate hike would be a reasonable move—it’s merely a matter of timing—and it remains unclear whether Fed officials completely disregard the potential strong negative reaction such a move might trigger in U.S. equities. As a result, financial markets are expected to remain highly volatile in the short term. Regarding gold, although it currently sits above the 270-degree Gann square level at $4,410, it continues to test the $4,400 support zone intermittently, exhibiting sharp fluctuations over shorter timeframes. Personally, I anticipate that gold will retest its peak and decline again following the release of the U.S. CPI data this Friday. The main reason is that both August PPI and CPI are unlikely to reflect any cooling in inflation. As long as inflation remains elevated, the market will still face the risk of a Fed rate hike next week, making it unwise to hold long positions through the weekend. The U.S.-Iran situation represents another risk factor, and investors should pay close attention. If gold breaks below $4,390, a stronger one-way downtrend may emerge. At best, gold could trade between $4,460 and $4,410; however, if it falls below $4,410 again, the risk of breaking below $4,390 will significantly increase. The above information is for reference only and does not constitute investment advice.
2026-09-09
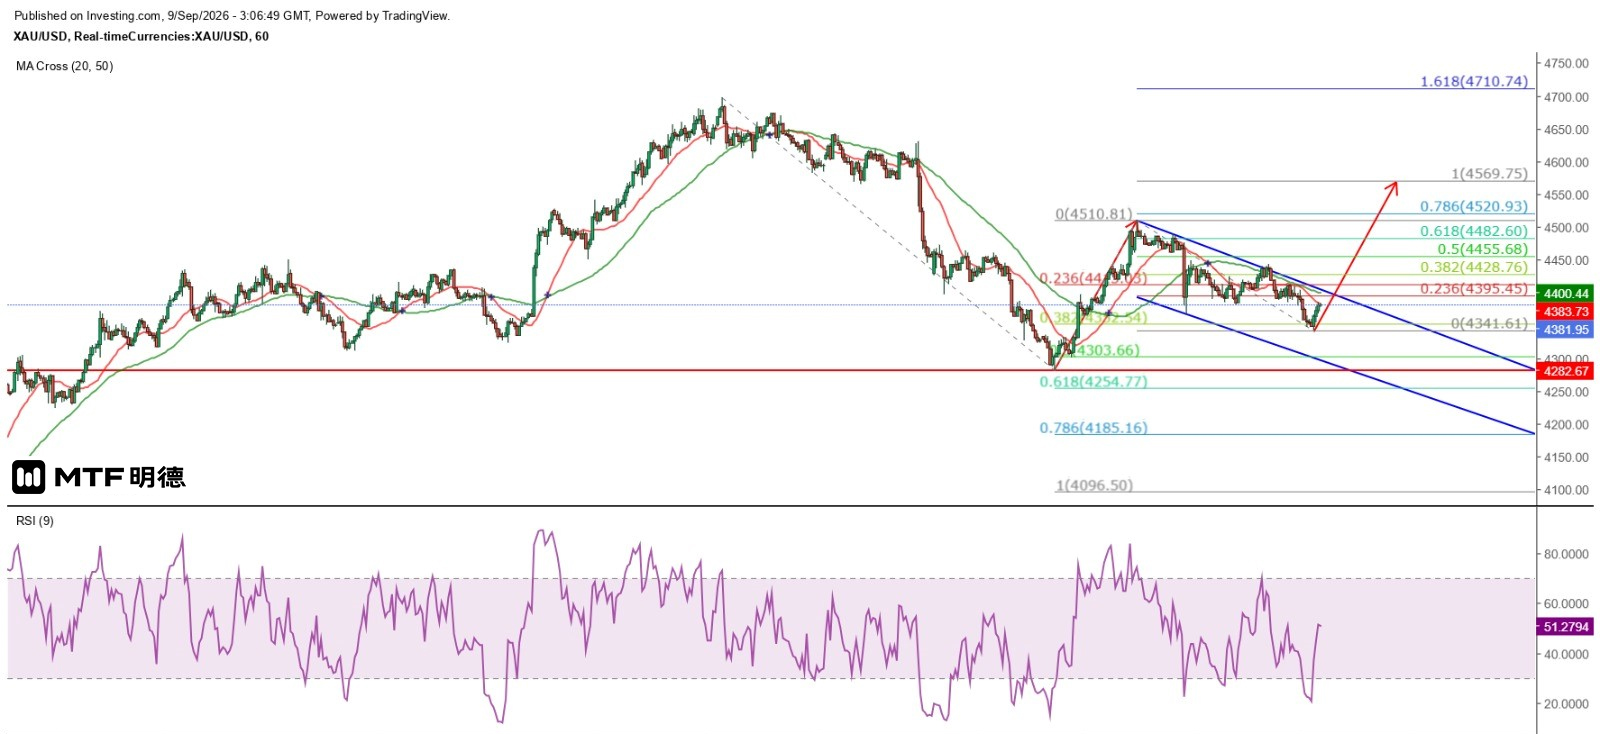
Gold prices remain primarily driven by buying on dips Completed on 9/9/2026 at 11:06 Yesterday's gold price volatility was unprecedented since the all-time high, with sharp and frequent fluctuations that made it a nightmare for trend followers. This has forced investors to bear higher stop-loss risks, while short-term traders must stay closely attuned to market movements and avoid being lured by price breakouts—otherwise, they too face substantial losses. Therefore, investors should adopt systematic trading strategies to prevent emotional decisions from affecting their buy-sell judgments. The intraday range for gold is expected to remain between $4,310 and $4,410; thus, when prices approach these levels, investors should immediately close any unfavorable positions upon seeing strong reversal signals on either the hourly or one-minute charts. Yesterday, gold failed to effectively break above the extended descending trendline from September 3rd and continued to decline within a balanced downward channel. However, after touching a low of $4,341.61 in this morning’s Asian session, spot gold formed a powerful bullish engulfing pattern on the hourly chart, suggesting that gold may have indeed signaled a bottom as anticipated today. While further declines are still possible following the rebound, today’s short-term bottom signal remains intact. Measuring the move since September 2nd using Fibonacci extensions from this morning’s low, a 100% extension would push gold up to $4,569.75. Although, viewed over longer timeframes, gold could potentially initiate a second leg down from September 3rd, with a 100% extension implying a drop to $4,096.50, this scenario is currently ruled out. The reason is that the hourly chart shows a head-and-shoulders top pattern over a broader timeframe, with the neckline at $4,282.67. Unless this level is clearly breached, and given today’s tendency toward a short-term bottom, the main strategy remains buying on dips. The above information is for reference only and does not constitute investment advice.
2026-09-08
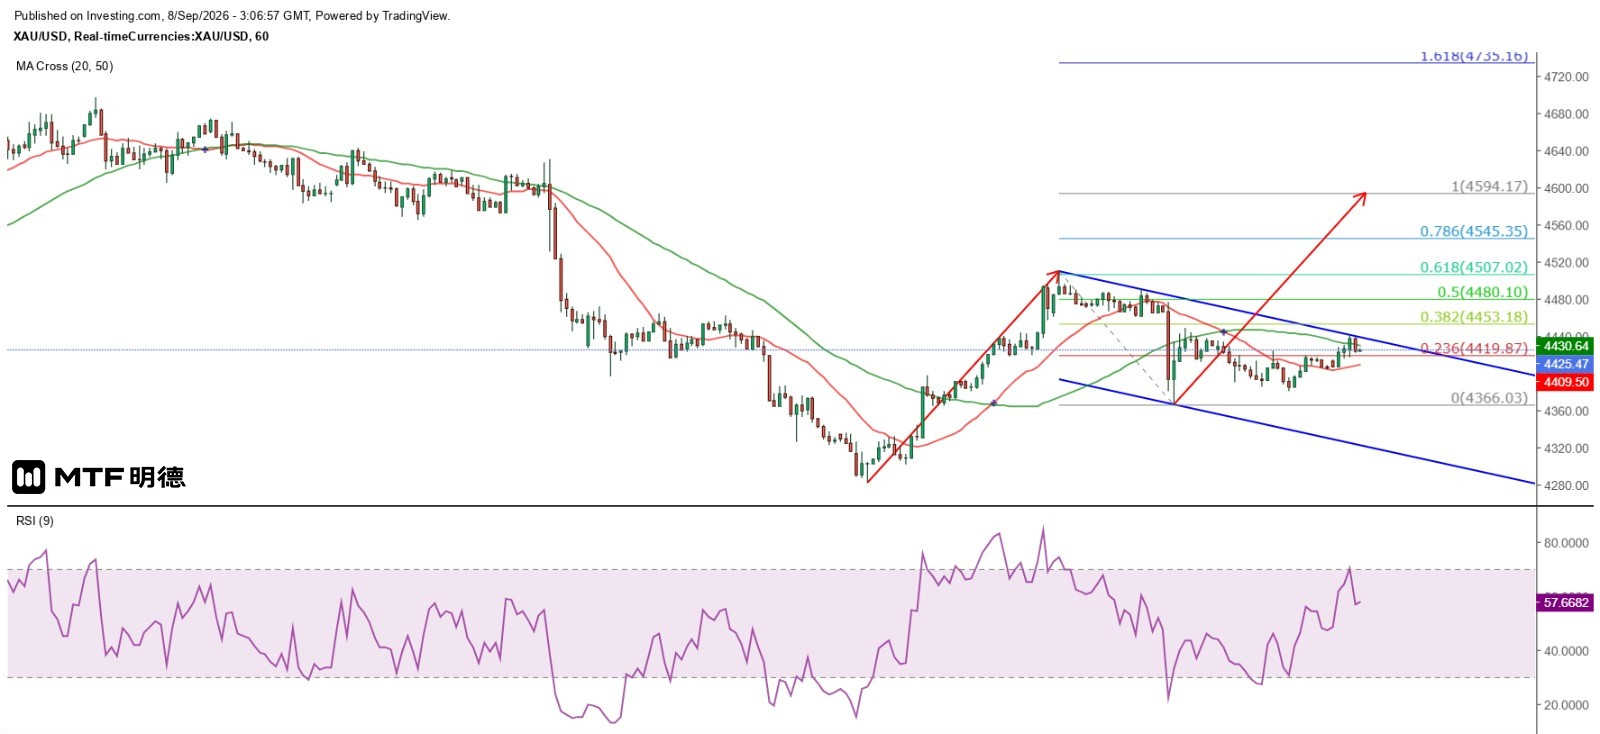
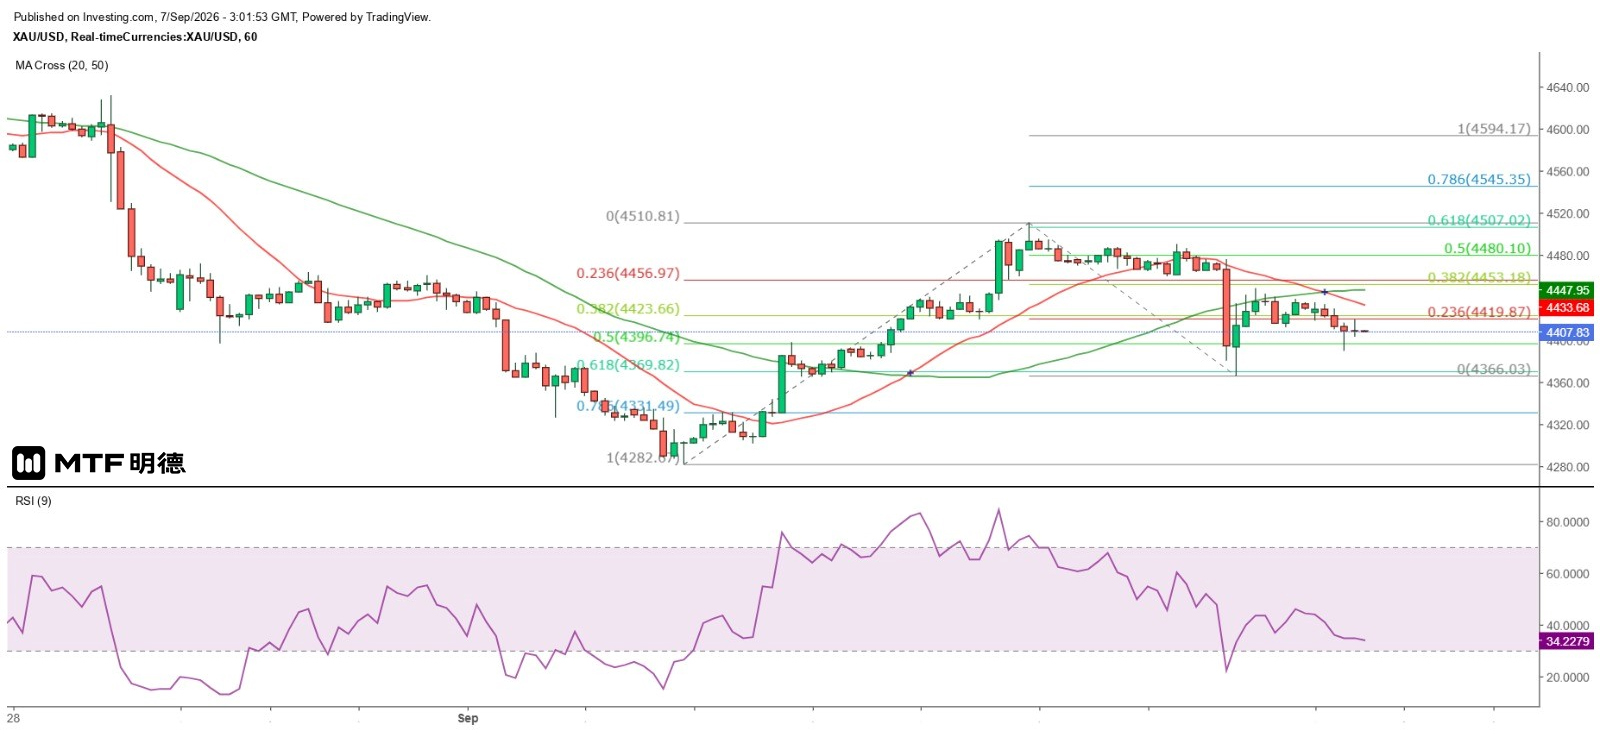
"Gold Price Holds Steady at 4,410, Set for an Upward Breakout" – Completed on 8/9/2026 at 11:04 Yesterday, spot gold prices remained weak during the European morning session, dipping as low as $4,381.23 before stabilizing and gradually recovering. In the early New York session, it broke above the hourly 20SMA (currently around $4,409), then pulled back to consolidate before opening higher with a gap in today's Asian market, further strengthening to $4,440.84—surpassing the hourly 50SMA (currently around $4,432). However, on the hourly chart, gold is clearly constrained by a descending trendline drawn from the high of $4,511 on September 3, forming a bearish double-hourly reversal pattern. The technical resistance facing gold reflects traders' lack of clear direction, indicating a need for fresh market signals. ADP will release its latest weekly private-sector employment data tomorrow. Last Friday’s market reaction to stronger-than-expected non-farm payrolls was brief, suggesting skepticism about the Fed raising interest rates at next week’s meeting. Logically, if the Fed did not cut rates due to the initial July non-farm jobs drop of 23,000, why would it raise rates based on a single month of 162,000 job gains in August? Therefore, the ADP weekly employment report is likely to cause volatility rather than trigger a breakout. Regarding gold, it currently appears to be near the top of a balanced descending channel, while the double-hourly reversal suggests a higher probability of renewed downward movement. Short-term cyclical patterns indicate that the downtrend may reverse on Wednesday, though whether this will be triggered by weaker-than-expected ADP data remains to be seen. Additionally, the U.S. August PPI and CPI reports are scheduled for release this Thursday and Friday, respectively. I believe that if these figures meet expectations, the likelihood of a Fed rate hike next week will diminish. Moreover, would FOMC members supporting a rate hike suddenly increase from three (rotating members) to seven? Investors should therefore consider the possibility of a bullish move in gold. Once it breaks through the hourly descending trendline resistance, using Fibonacci extension at 100% of the move since September 2, gold could rise to $4,594.17. The hourly 20SMA at $4,409 will become a key intraday support level—coincidentally close to Gann’s square vertical angle at 270 degrees, offering strong support. The above information is for reference only and does not constitute investment advice.
2026-09-07
Gold Prices Remain Volatile, But 4366 Still Holdable July 9, 2026, 10:56 AM Last Friday, gold prices turned downward as expected, primarily due to strong U.S. non-farm employment data for August. The number of new jobs added in the previous month reached 162,000—nearly triple the market's expectations. Additionally, July’s job figures were revised upward from an initial decline of 23,000 to a gain of 21,000. The unemployment rate remained steady at 4.1%, while year-on-year average hourly earnings growth slightly declined from 3.2% to 3.1%. The unexpectedly robust labor market data boosted the dollar, causing gold prices to plunge by over $100 at one point. Spot gold initially dipped to a low of $4,366.03 in early New York trading before recovering noticeably. Strong employment data does not necessarily mean the Federal Reserve will consider raising interest rates. This week’s release of August CPI data will indicate whether improvements in the labor market can translate into stronger consumer spending and further inflationary pressure. Currently, markets expect the overall CPI to remain unchanged at 3.4% year-on-year, while core CPI is projected to slow slightly from 2.5% to 2.4%. This suggests that overall inflation remains high but has not accelerated further. Meanwhile, core inflation—the Fed’s primary gauge—appears to be easing gradually, which is insufficient to push the number of FOMC members supporting a rate hike above the threshold. However, even if inflation does not continue rising, the Fed’s lack of action on persistently high inflation provides market participants with reasons to sell the dollar and shift funds into other assets. Whenever confidence in the dollar wanes, gold becomes a natural destination (as no other fiat currency is more trusted than the U.S. dollar). Last week’s market was highly volatile, and similar fluctuations are expected this week. After breaking above the 20-day simple moving average (SMA) on the daily chart last week—currently around $4,467—gold clearly encountered resistance and subsequently reversed sharply lower. Therefore, the 20-SMA now serves as the key short-term resistance level, while $4,366 acts as a crucial support. If this level breaks, gold could test the Gann 225-degree angle at $4,310 for further support, which is likely to offer strong resistance. For now, it appears gold should hold above $4,366 and attempt a gradual recovery toward higher levels. The large bearish candlestick peak at $4,476.35 from last Friday will act as a significant short-term resistance. Intraday price movements are expected to remain contained between $4,476 and $4,366. The above information is for reference only and does not constitute investment advice.
2026-09-04
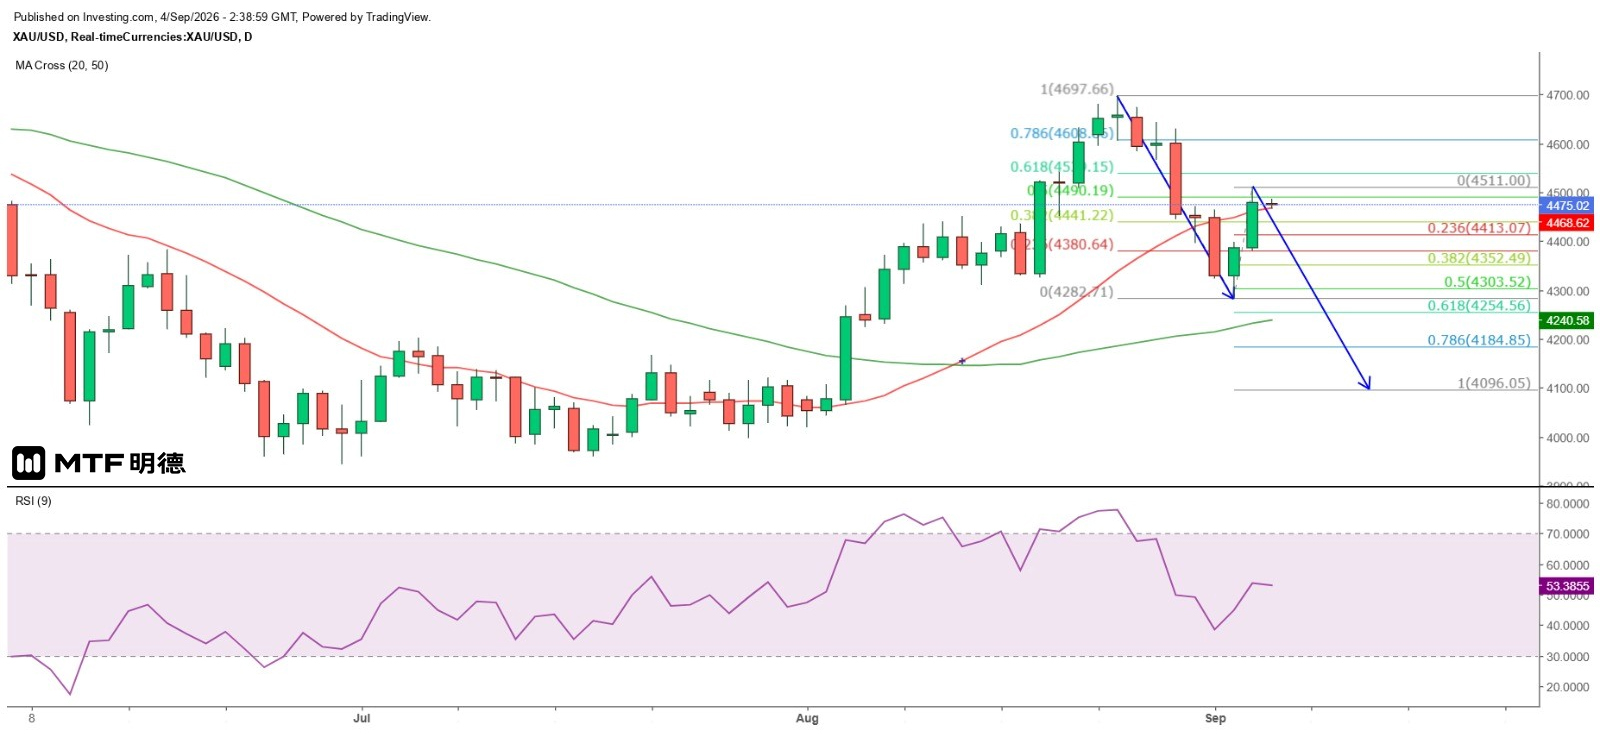
Gold Price Likely to Reversal and Decline Today – 9/4/2026, 10:38 AM Yesterday, spot gold prices peaked at $4,511, just one dollar above the upper end of the volatility range I had indicated earlier. Last week, comments by Federal Reserve Chair Waller at the Jackson Hole central bank symposium on inflation and interest rates were interpreted by markets as hawkish, triggering a sharp drop in gold prices. However, after hitting a low of $4,282.71 on Wednesday, gold reversed course within a single day, rising further yesterday to close above the 20-day simple moving average (currently around $4,468). This morning, it has been trading narrowly above that level. The rapid rise in gold prices appears to have been driven by remarks from Fed Governor Waller, who stated that if inflation continues to moderate steadily, he would support keeping interest rates unchanged at the mid-month policy meeting. He noted that the three-month core inflation rate, which the Fed closely monitors, has dropped significantly from 4.76% in February to the current 3.05%, indicating effective control over price pressures. Additionally, tariffs and energy price fluctuations have prevented inflation from spreading widely across the economy. Nevertheless, he emphasized that August's PPI and CPI data will influence his decision. These figures are scheduled for release on September 10 and 11, respectively. Given that gold prices have already climbed to $4,511 ahead of the August non-farm payroll report, unless employment unexpectedly declines again, the likelihood of gold falling after the data release is very high. On the daily chart, gold has rebounded more than 50% from its August 25 lows and has slightly surpassed the 20-day SMA. Cyclical trends also suggest a reversal today, making it unlikely that gold can sustainably stay above $4,500 in the short term. Conversely, using Fibonacci extension levels, if gold reverses downward again, a 100% extension could push prices down to $4,096.05. The above information is for reference only and does not constitute investment advice.
2026-09-03
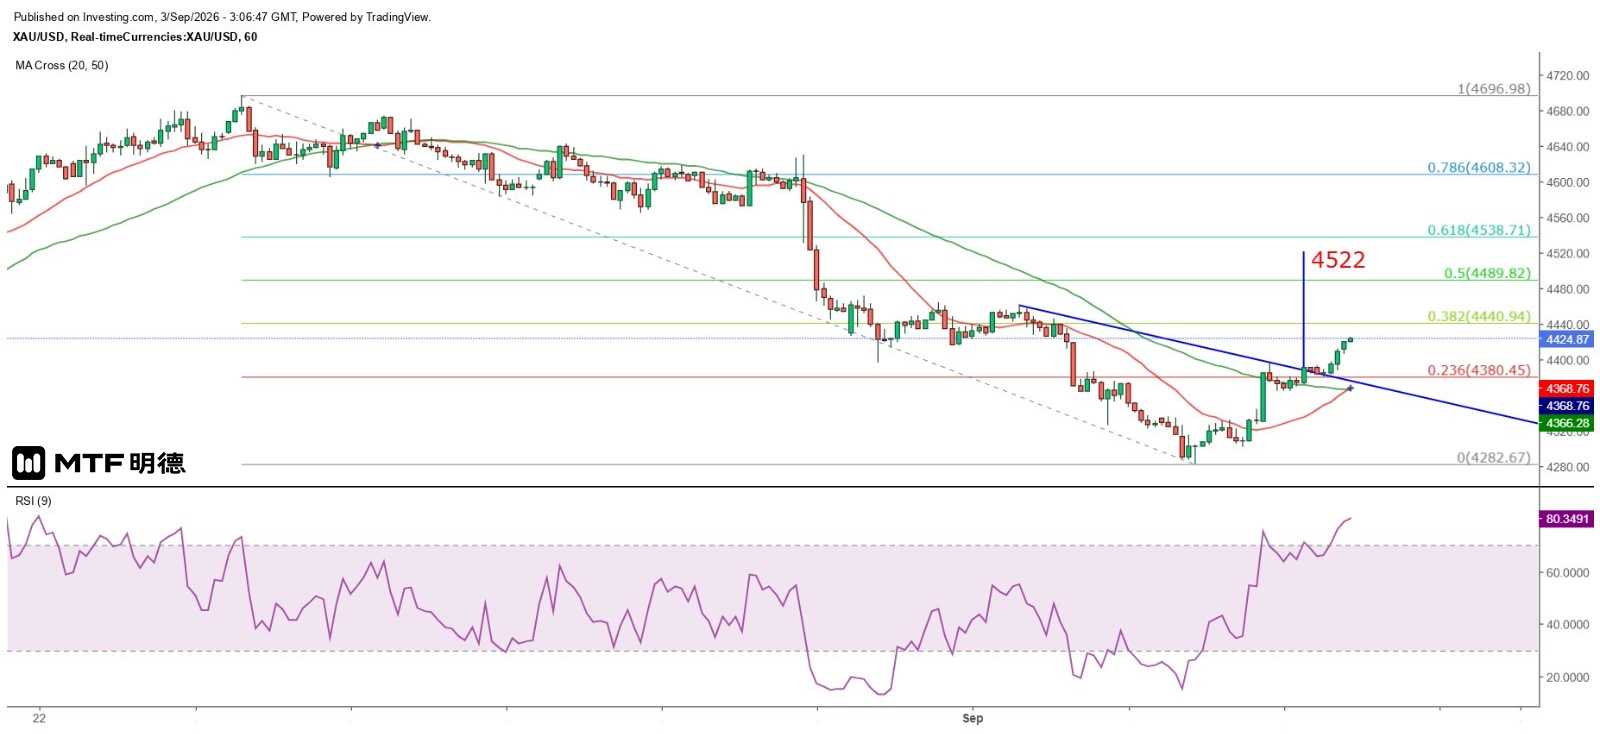
Gold Price Holds Steady at 4,410, Awaiting an Upward Breakout March 9, 2026, 11:04 AM As expected, gold prices rebounded, primarily driven by the ADP employment data released last night. The report showed that private-sector job growth in August added only 38,000 positions—below the anticipated 47,000 and slightly revised upward from the previous figure of 44,000 to 46,000. This marked the second-worst monthly performance so far this year. From January to August, the average monthly job gain stood at 68,000. These figures have led markets to expect that tomorrow’s official non-farm payroll report will also show a slowdown in labor market growth, cooling expectations for further Federal Reserve rate hikes. On the hourly chart, spot gold hit its lowest level of the day at $4,282.67 during yesterday’s Asian session before gradually recovering. However, following the release of the ADP data, gold showed little immediate reaction. It wasn’t until 45 minutes later that it surged above the 50-period SMA (currently around $4,366), reaching a high of $4,397.37. After briefly consolidating along the moving average, gold rose again toward the end of the New York session, peaking at $4,391.45. This morning in Asia, gold continued its upward momentum, pushing higher and setting new intraday highs above $4,425. Technically, gold appears to have stabilized above the 50SMA and is now poised to break through and reestablish support at the Gann 270-degree vertical angle at $4,410. With favorable confirmation from the upcoming non-farm data, gold could target $4,460 and potentially even challenge $4,510 again. Using Fibonacci retracement levels, if gold rebounds by 50% of its largest decline since August 25, it could reach $4,489.82—a key resistance level to watch. According to the TD line analysis, the projected price target after breaking above the descending trendline is approximately $4,522. Therefore, gold is likely to trade between $4,410 and $4,510 over the next two days. However, should the August non-farm data come in strongly—such as with job gains exceeding 150,000 or even 200,000—$4,410 could once again become a significant resistance level, while $4,210 would face a serious test. The above information is for reference purposes only and does not constitute investment advice.
2026-09-02
Gold prices are highly sensitive to the upcoming non-farm data. 2/9/2026 11:19 AM After failing multiple times to break above $4,450 over the past two trading sessions, gold has broken downward. As seen on the hourly chart, prices continued to hit a recent low in this morning's Asian session at $4,287.54, with the weak support level of the Gann 225-degree angle at $4,310 also giving way. However, the 9RSI has dropped to 15, suggesting a strong rebound is likely. Conservative investors should wait patiently for a bullish engulfing pattern on the hourly chart before entering the market. Friends are currently awaiting tonight’s ADP release of August non-farm employment data as a potential turning point. The market currently expects an increase of 48,000 jobs. Unless new job additions exceed 100,000, gold is expected to rally significantly. Nevertheless, the market may still consolidate at lower levels or even drop near $4,210, clearing out long positions before positioning ahead of Friday’s official non-farm employment report. On the daily chart, gold has already fallen below the 20SMA (4,445), with the 50SMA (4,222) now serving as the final defense line. I believe gold still has strong potential to hold this level. It’s important to note that when prices approach key support levels just before major data releases, they often reverse regardless of how poor the data turns out. The $4,210 level lies along the Gann square’s 180-degree angle, making its support stronger than that at $4,310. If we consider further downside risks—such as a breakdown below $4,200 or even $4,000—the first trigger would be the Federal Reserve’s September rate decision. Only if both non-farm employment and inflation move in the same direction will the probability increase. At present, these factors remain in tension. The above information is for reference only and does not constitute investment advice.
2026-09-01
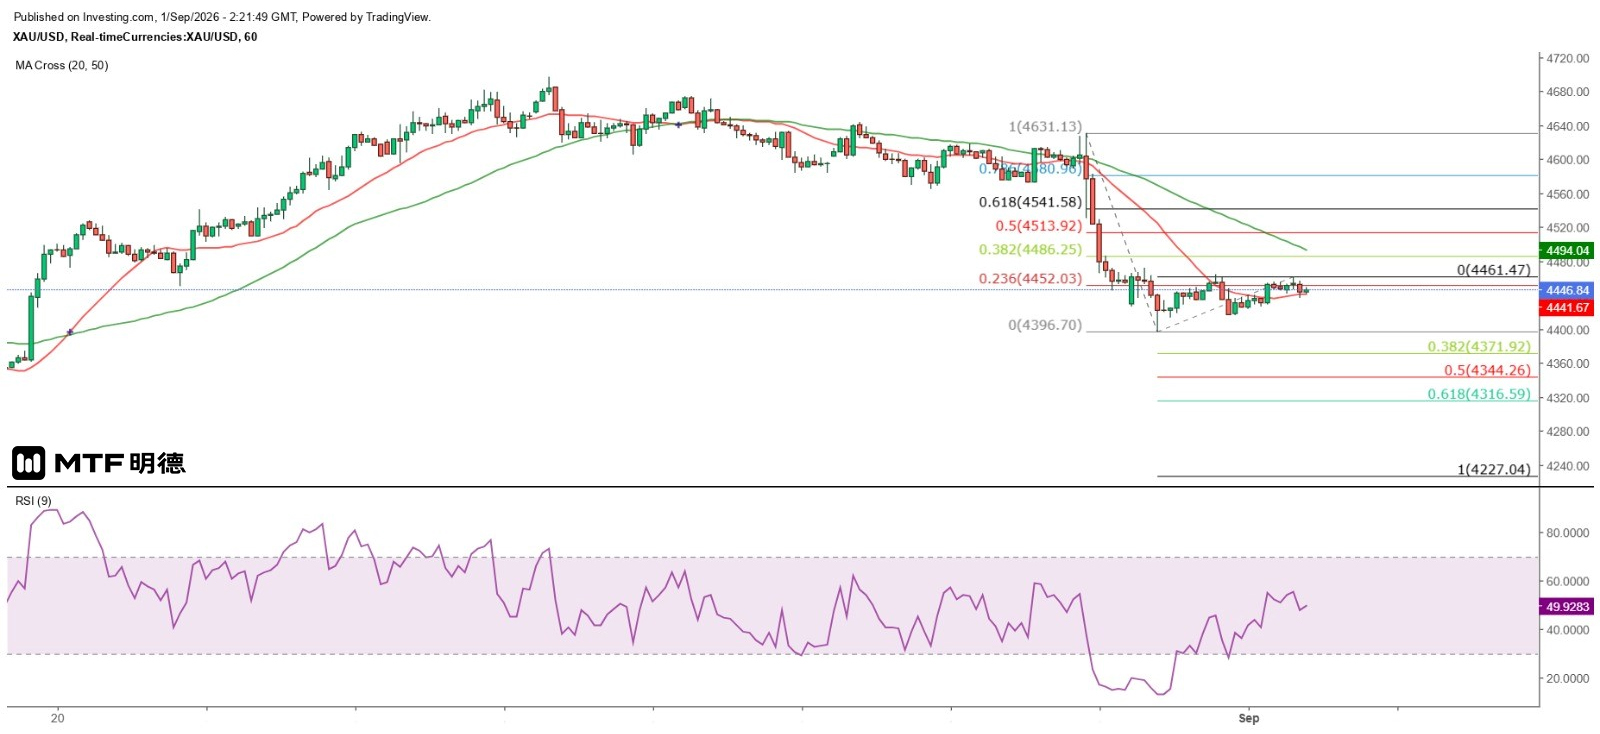
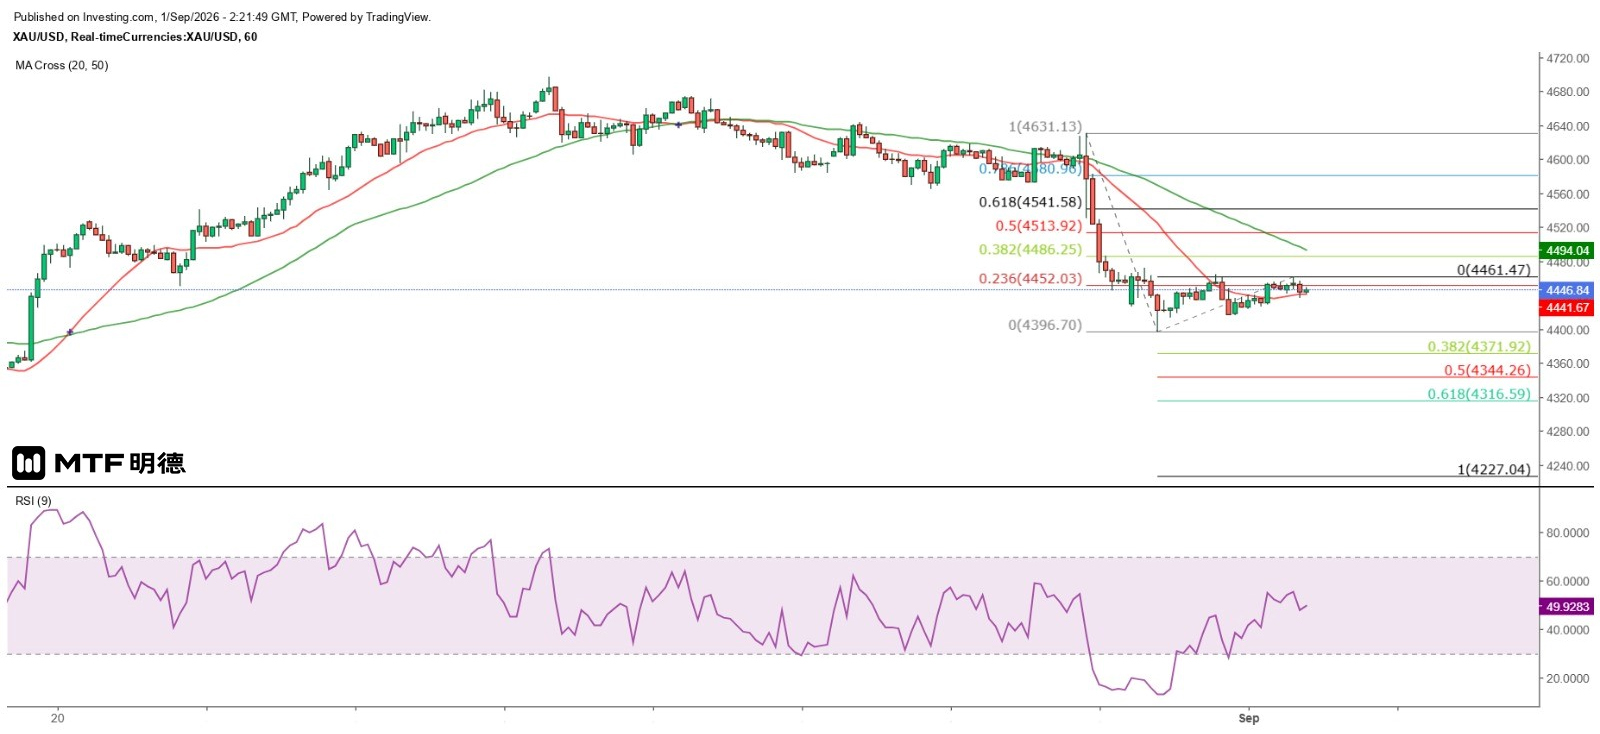
"Gold Volatility Narrows, Awaiting Breakout" – Completed on 1/9/2026 at 10:20 Yesterday's gold price showed unusually calm movement. Spot gold initially surged to $4,464.07 during early Asian trading, then quickly reversed, dipping as low as $4,415.74 before beginning a rebound. However, the day’s high and low were effectively established within this two-and-a-half-hour window. Gold failed to break out of this less-than-$49 range during both European and New York sessions. Markets appear temporarily confident in the Federal Reserve’s resolve under Powell to combat inflation, yet this contrasts sharply with the weak labor market. Gold briefly tested below the 20-period SMA on the daily chart ($4,447), suggesting that traders are awaiting a clearer breakout signal. On the same timeframe, my personal preference—or perhaps habit—is not to chase sell opportunities when prices reach major moving averages, nor do I buy aggressively upon reaching them; instead, I wait for new breakout signals from the market before acting. Currently, gold is hovering near the 20-period SMA on the daily chart, so if you're considering selling, it would be wise to look for confirmation from other timeframes. For example, on the hourly chart, the downtrend appears more evident—though stop-loss levels should also be determined based on this shorter-term view. Looking at the hourly chart, the first noticeable pattern is a descending flag formation. The rebound from yesterday’s low reached only about 23.6% of Friday’s New York high-to-low decline, placing the current level around $4,460, indicating relatively weak momentum. Measured by a 1:1 Fibonacci extension, gold could potentially fall further to $4,227. If a true downward breakout occurs, which price levels might offer significant support before reaching $4,227? From a Gann Square perspective, $4,310 lies along the 225-degree angle, representing weak support (or weak resistance). $4,210 sits at the 180-degree angle, marking strong support (or strong resistance). The projected downside target of $4,227 is close to this strong support zone at $4,210, suggesting that a bounce may be imminent once gold approaches $4,227. Meanwhile, $4,316.59 corresponds to the 61.8% Fibonacci extension, while $4,344.26 marks the 50% extension level. Therefore, the area between $4,344 and $4,316 could represent the first key support zone. Should gold break above $4,460, resistance is expected at $4,510—the Gann 315-degree angle. The above analysis is for informational purposes only and does not constitute investment advice.
2026-08-31
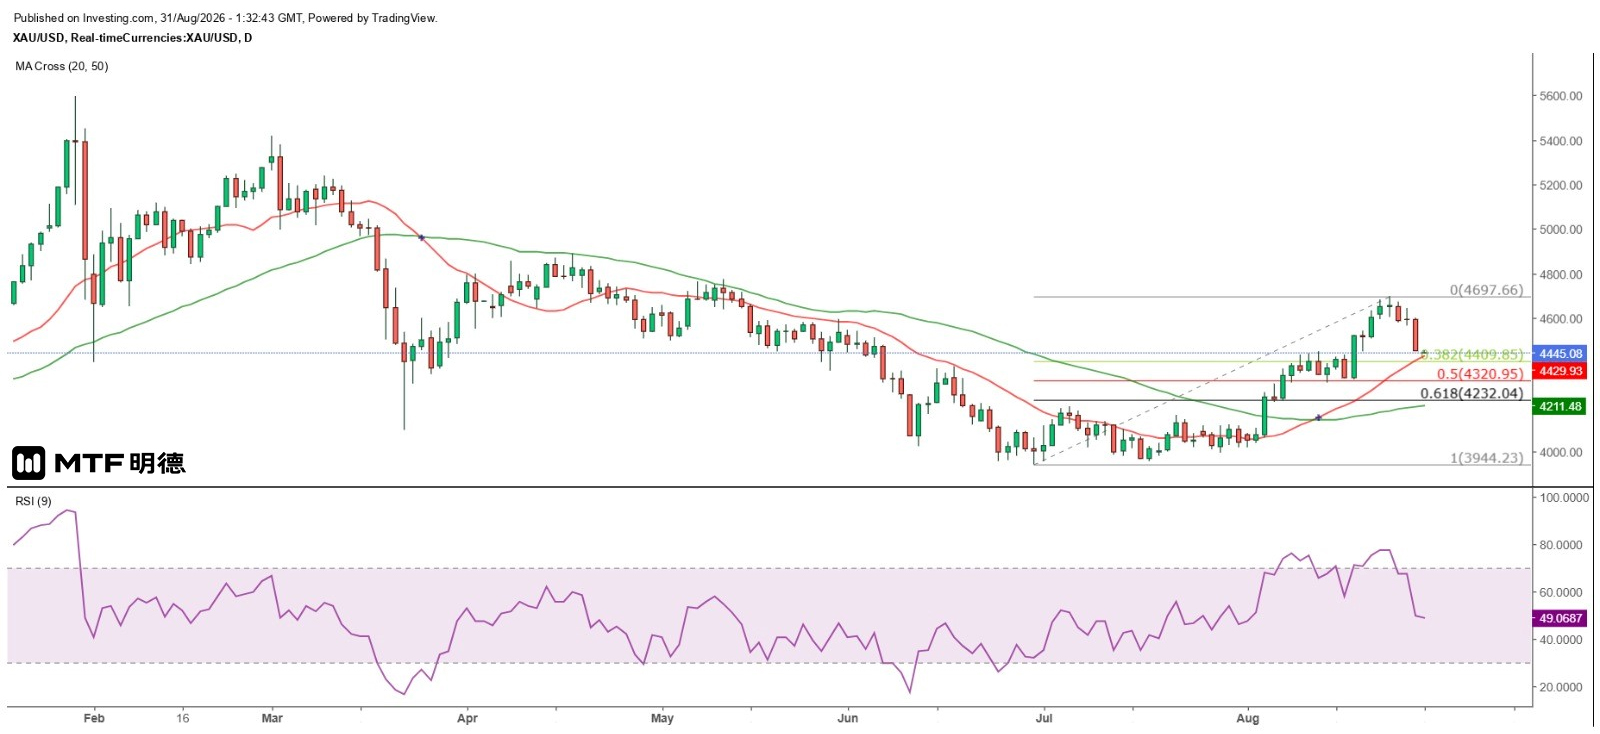
"Gold Price Supported Strongly at $4,410" – Completed on 31/8/2026 at 9:31 At the Jackson Hole Global Central Bank Symposium, Federal Reserve Chair Waller delivered a firm stance on inflation and monetary policy—exactly as I anticipated. He emphasized that bringing the personal consumption expenditure (PCE) inflation rate back to 2% is an "unwavering hard target." He noted that the Fed has failed to meet this goal for several consecutive months, and current inflation data remains concerning. Regarding the possibility of further rate hikes, he stated clearly that inflation is fundamentally a result of monetary policy choices. If core inflation does not decline toward the target quickly and with a clear direction, the central bank will not rule out additional tightening, adding that there is still work to be done. On financial conditions, he argued that current monetary policy and the overall financial environment are not yet contractionary, nor have they significantly suppressed economic activity, leaving room for further tightening by the Fed. His remarks were interpreted by markets as a highly hawkish stance. Interest rate futures reflected a sharp rise in expectations for a 25-basis-point hike in September, jumping from under 40% a week earlier to 59.7%, with further expectations of another 25-basis-point increase in December. U.S. Treasury yields and the U.S. dollar index both surged. However, the U.S. Department of Labor will release the August non-farm payroll report this Friday, with forecasts pointing to job gains of just 58,000—still a relatively low figure. With midterm elections approaching and tensions between the U.S. and Iran temporarily easing, it is unlikely the Fed will choose to raise rates at this moment. The spot gold price opened lower in today's Asian session, falling to a low of $4,442.21 before gradually recovering. However, after rebounding to $4,466.89, it turned lower again. On the daily chart, gold has approached the 20-day simple moving average (SMA) at $4,430. I believe this level offers short-term support; even if broken, a reversal pattern within a single day is likely. Using Fibonacci retracement on the move since June 30, a 38.2% correction would bring the price to $4,409.85. Given that Gann’s square vertical angle at 270 degrees lies at $4,410, this level is expected to remain a key short-term support. Cyclical analysis also suggests that gold may have bottomed out today, making further buying at these lows riskier. Therefore, I expect gold to trade within a range of $4,410 to $4,510 today. The above information is for reference only and does not constitute investment advice.
2026-08-28
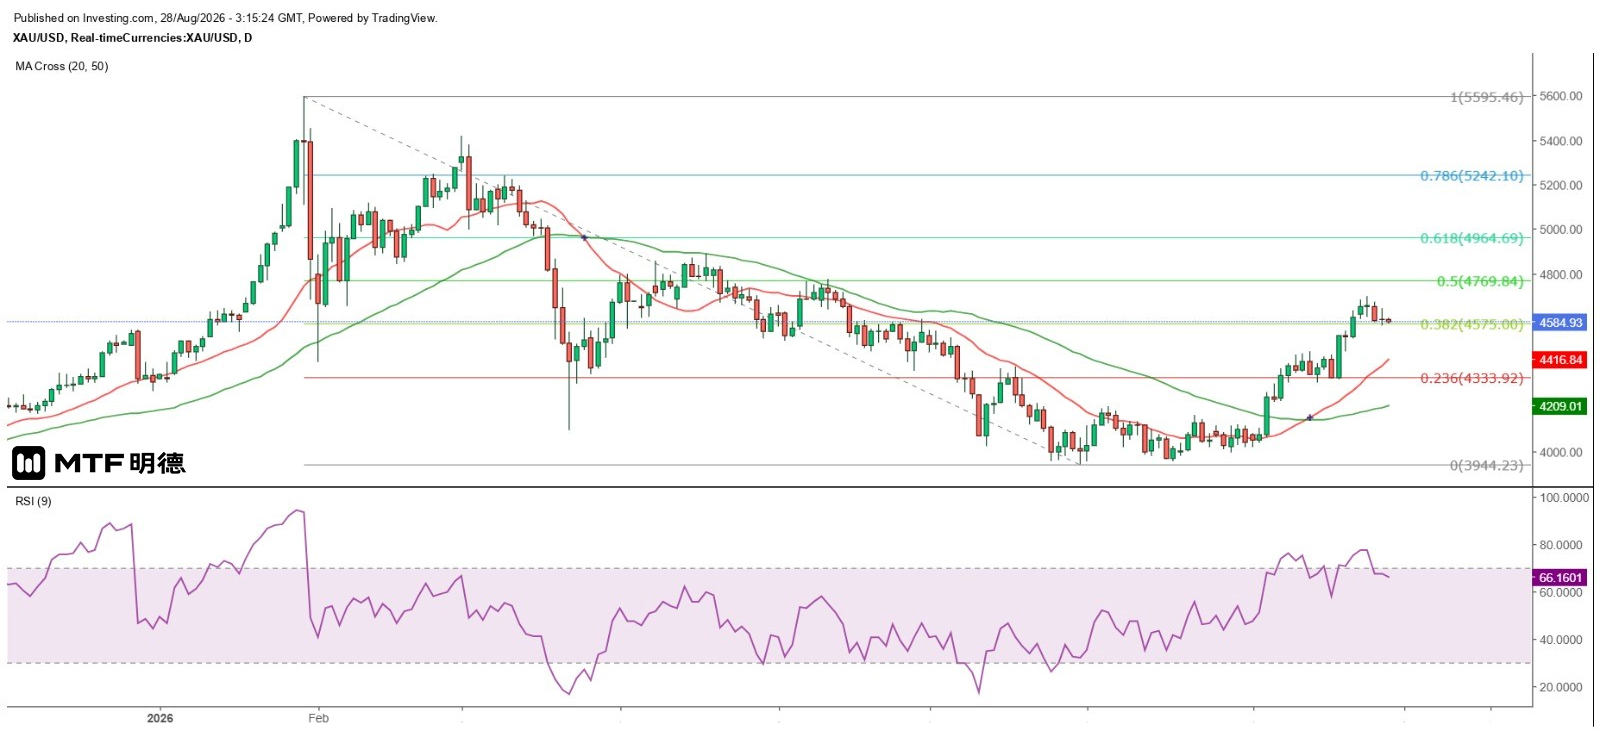
Gold price expected to test 20-day moving average before rebounding August 28, 2026, 11:14 AM The U.S. July PCE data showed no signs of easing inflation, continuing to weigh on gold prices. Meanwhile, three Federal Reserve officials voiced hawkish stances. Kansas City Fed President Schmid indicated that current short-term interest rates may be at a relatively loose level; Cleveland Fed President Hammack stated that the present rate levels are insufficient to bring inflation down on their own and urged policymakers to act immediately; Boston Fed President Collins added that he would support a rate hike if there were no clear evidence of sustained inflation decline. Yesterday marked the opening of the Jackson Hole Global Central Bank Symposium, where Federal Reserve Chair Waller will speak today. Markets expect him to maintain his typically cautious and reserved approach, with several institutions predicting he will not issue any clear signals regarding the future direction of interest rates. However, in my view, Waller is not avoiding communication with markets but rather reluctant to repeat unoriginal arguments. This year’s Jackson Hole theme is "Financial Innovation," focusing on its impact on payments and policy. Given this is a central bank symposium, the relevant "policy" naturally refers to monetary policy, while "payments" relate to money flows—factors influencing overall economic activity and price movements, thereby affecting inflation. Waller may use this opportunity to discuss how financial innovation impacts inflation and monetary policy, then explain these dynamics within the current economic context, subtly reflecting potential interest rate trends. The Fed's hawkish stance has become increasingly evident. The spot gold price peaked at $4,697.66 on Tuesday, approaching the 50% retracement level of the year's January high of $5,595.46 to the June-end low of $3,944.23, which stands at $4,769.84. On Wednesday, the market signaled another downturn, and the current rally has yet to close above $4,660. With $4,600 now breached, the next likely target is the daily chart’s 20-period SMA at $4,417. Only after testing this level could a recovery potentially resume. In the near term, $4,510 remains the immediate downside target, while resistance lies at $4,610. The above information is for reference only and does not constitute investment advice.
2026-08-27
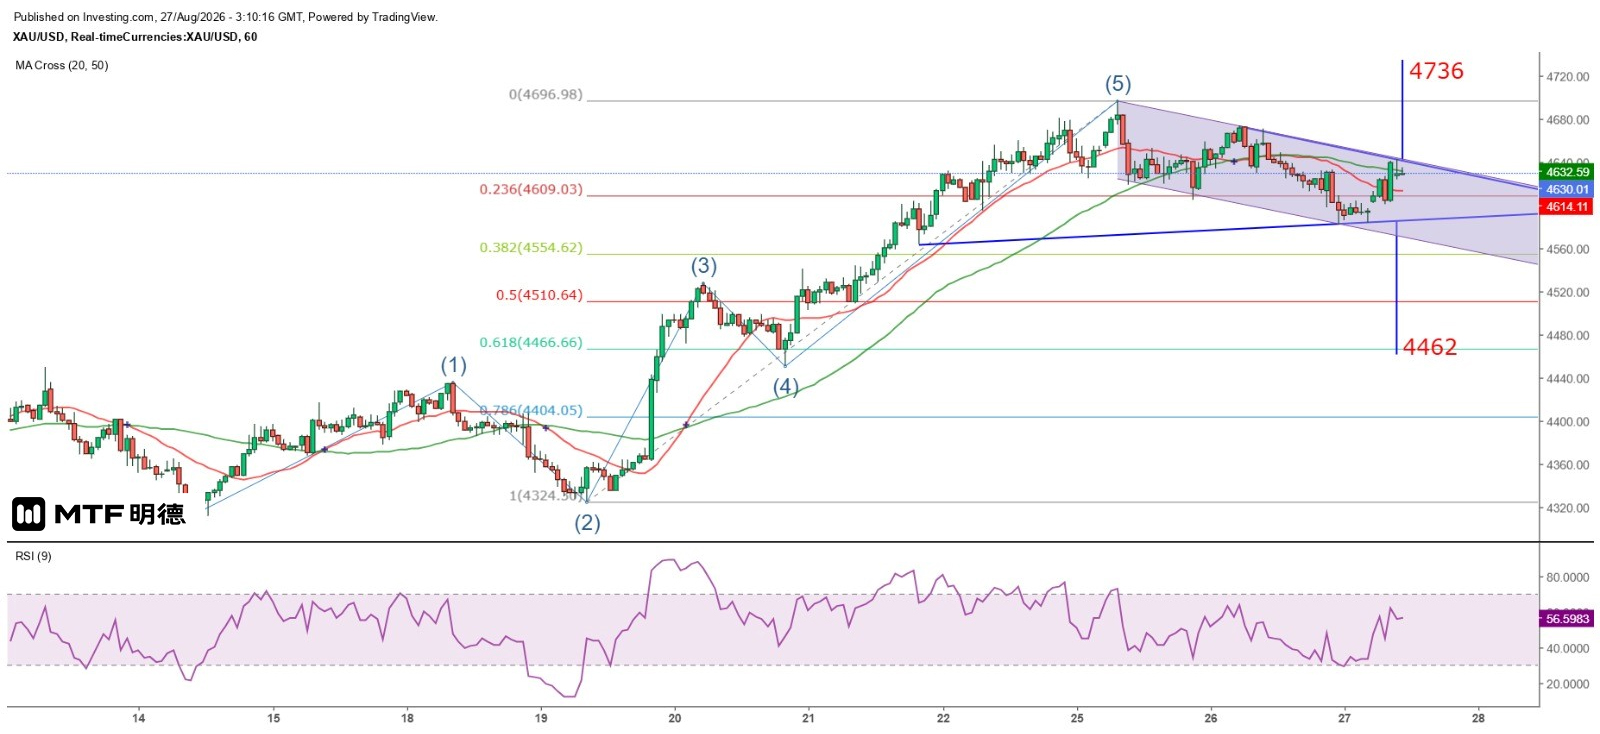
"Gold Needs to Fall to $4,510 for Support" – Completed on 27/8/2026 at 11:09 Yesterday's U.S. data showed that the core PCE inflation rate in July remained unchanged at an annual increase of 3.3%, marking the eighth consecutive month above 3%. The monthly rise also slightly expanded by 0.1 percentage point to 0.2%. Overall PCE inflation held steady at a year-on-year gain of 3.7%, the fifth consecutive month exceeding 3%. This figure appears clearly influenced by U.S. military actions against Iran, indicating no signs of cooling inflation. Interest rate futures suggest the market now expects a 25-basis-point rate hike by the Federal Reserve in December as the most likely outcome, with odds remaining around 45%. Meanwhile, the situation remains uncertain regarding how Powell will respond. Following the release of the data, gold prices plunged sharply, briefly falling below $4,600 before recovering. However, after reaching a high of $4,633.6, gold reversed again and closed the New York session near $4,583.28—close to yesterday’s first TD level target of $4,582. Nevertheless, this morning in Asian trading, gold opened higher and continued rising, reaching a temporary peak of $4,643.12. It remains clearly constrained by strong resistance at the Gann square angle level of $4,660. On the hourly chart, using TD analysis, if gold breaks below the TD ascending trendline at approximately $4,585, the next projected downside target would be around $4,462. Conversely, a breakout above the resistance line at about $4,246 could lead to a target of roughly $4,736. Technically, gold is currently positioned near the top of a balanced descending channel. Even if it manages to break upward, there is potential for a double-top formation with previous highs. Moreover, even if Powell does not deliver dovish remarks at the Jackson Hole central bank symposium (which is unlikely), gold lacks sufficient justification for a significant upward move. In the short term, gold is expected to remain capped by $4,660, with $4,510 still viewed as a key support level. The above information is for reference only and does not constitute investment advice.
2026-08-26
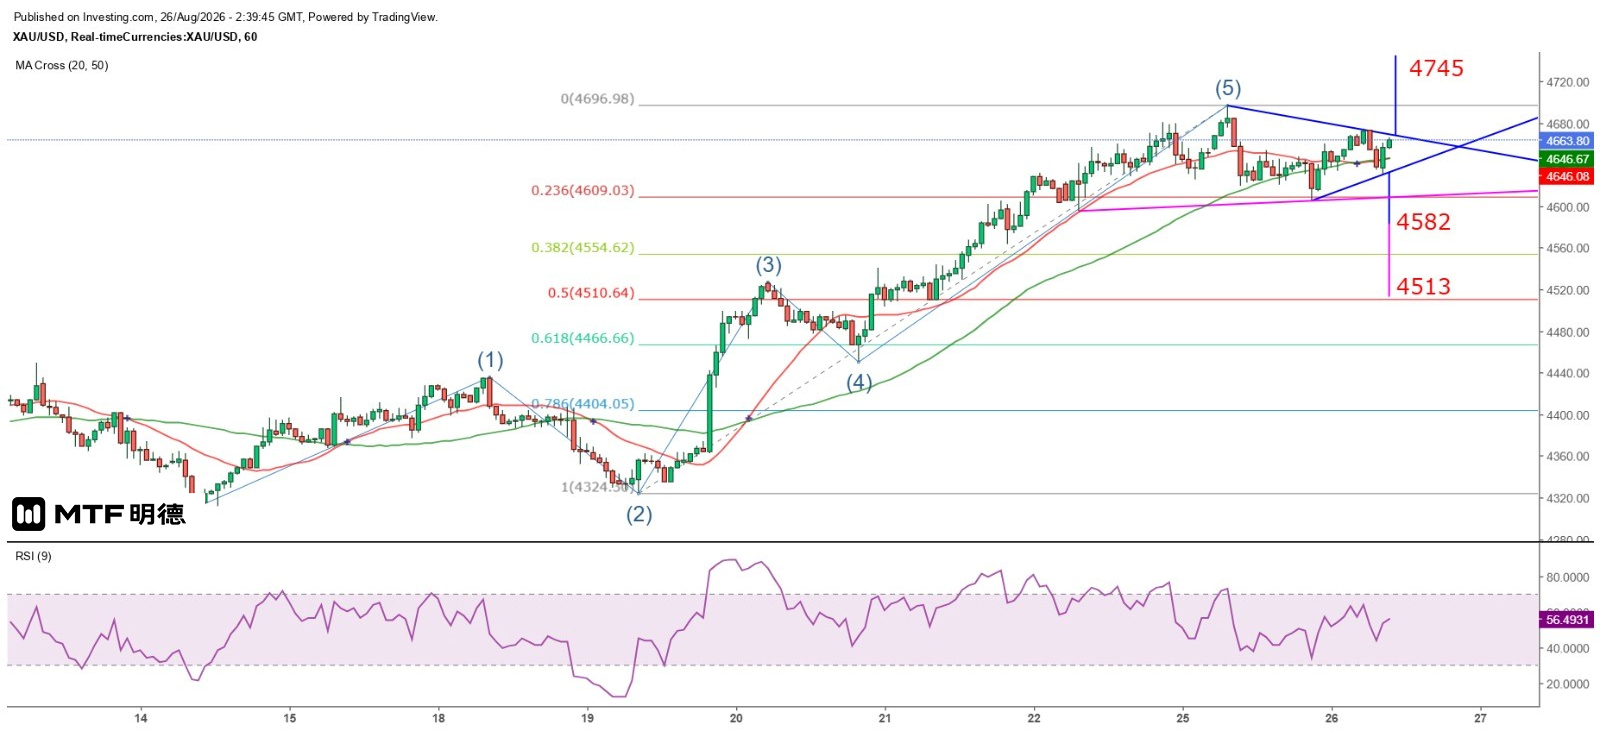
"Gold Price Likely to Experience Repeated Short-Term Declines" Completed on 26/8/2026 at 10:38 After reaching a high of $4,696.98 during early Asian trading yesterday, the spot gold price weakened and spent most of the European session consolidating around the hourly 50-period SMA (currently around $4,645). Following the opening of New York markets, it briefly plunged to $4,605.53 before recovering and gradually regaining ground. In today's early Asian session, it rose further to $4,673.83 but then declined again. On the hourly chart, gold may now be forming a descending wave pattern. Assuming that the fifth wave ended at yesterday’s high of $4,696.98, we are now likely in an abc corrective phase, with a breakdown below $4,450.82 being a key calculation point. From a technical perspective, a double-top formation is also possible, with $4,605.53 serving as the neckline. A break below this level would target approximately $4,514.08—a figure very close to the second-level TD line projection of about $4,513. Using the first-level TD count, the downside target would be around $4,582. Conversely, if gold breaks above the TD descending trendline, there is a high probability of a false breakout at this hour (10:00 AM), so any upward move should be measured based on the next hourly breakout. Under such a scenario, the upside target would be around $4,745. However, judging from short-term cyclical patterns, gold likely peaked yesterday, and prices are expected to decline repeatedly over the remainder of the week. The market’s reaction to tonight’s U.S. July PCE data will offer important clues, while the Jackson Hole Global Central Bank Symposium opens on Thursday—making a further breakout higher uncertain. The above information is for reference only and does not constitute investment advice.
2026-08-25
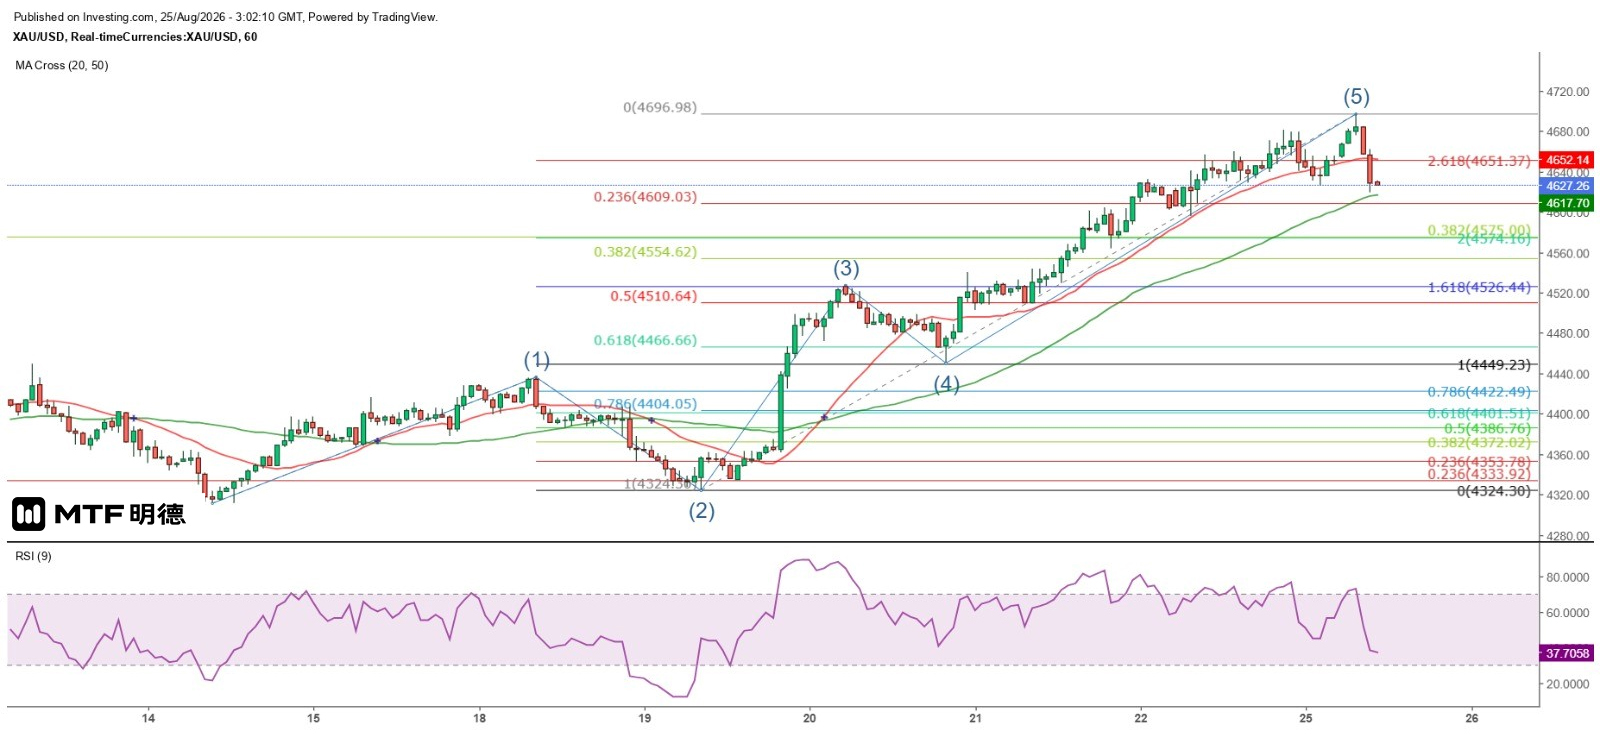
Gold Price Short-Term Target Down to $4,510 – August 25, 2026, 10:59 AM Although spot gold prices surged as high as $4,680.94 yesterday, they ultimately closed at $4,635.58, failing to hold above the strong resistance level of $4,660—the Gann square angle. On the daily chart, measured by Fibonacci extensions across three timeframes, selling pressure is mounting significantly above the $4,600 level. Since April 17, the price has advanced nearly 78.6% (reaching $4,687.37); since March 2, it has also approached the 50% extension level ($4,681.74). Measured from the January 29 historical high of $5,595.46, the rally has surpassed the 38.2% extension but still has over $100 of room to reach the 50% level at $4,769.84. Yesterday, we noted that gold may have completed its fifth wave and is now poised to enter a corrective ABC pattern—adjusting against the move since August 14. According to Elliott Wave theory, once the price breaks below the fourth-wave low, a higher-degree third wave will follow. Currently, the fourth-wave low stands at $4,450.84; therefore, after testing this level, traders should consider re-establishing long positions rather than chasing further declines. This morning, gold has already broken below the hourly 20-period SMA at $4,653, with lows approaching the 50-period SMA at $4,615.60—the closest pullback to this moving average since the upward breakout on August 19. While bullish investors might consider entering longs at this point, both higher time-frame analysis, short-term cyclical patterns, and fundamental and news-driven factors strongly suggest a high probability of breaking below the 50-period SMA. A break below this level could trigger additional stop-loss sell orders, further pressuring prices downward. Conservatively, gold is expected to stabilize only around $4,510. Therefore, it is advisable to establish short positions between the hourly 20- and 50-period SMAs, with partial profit targets set at $4,510 and $4,450. The above information is for reference purposes only and does not constitute investment advice.
2026-08-24
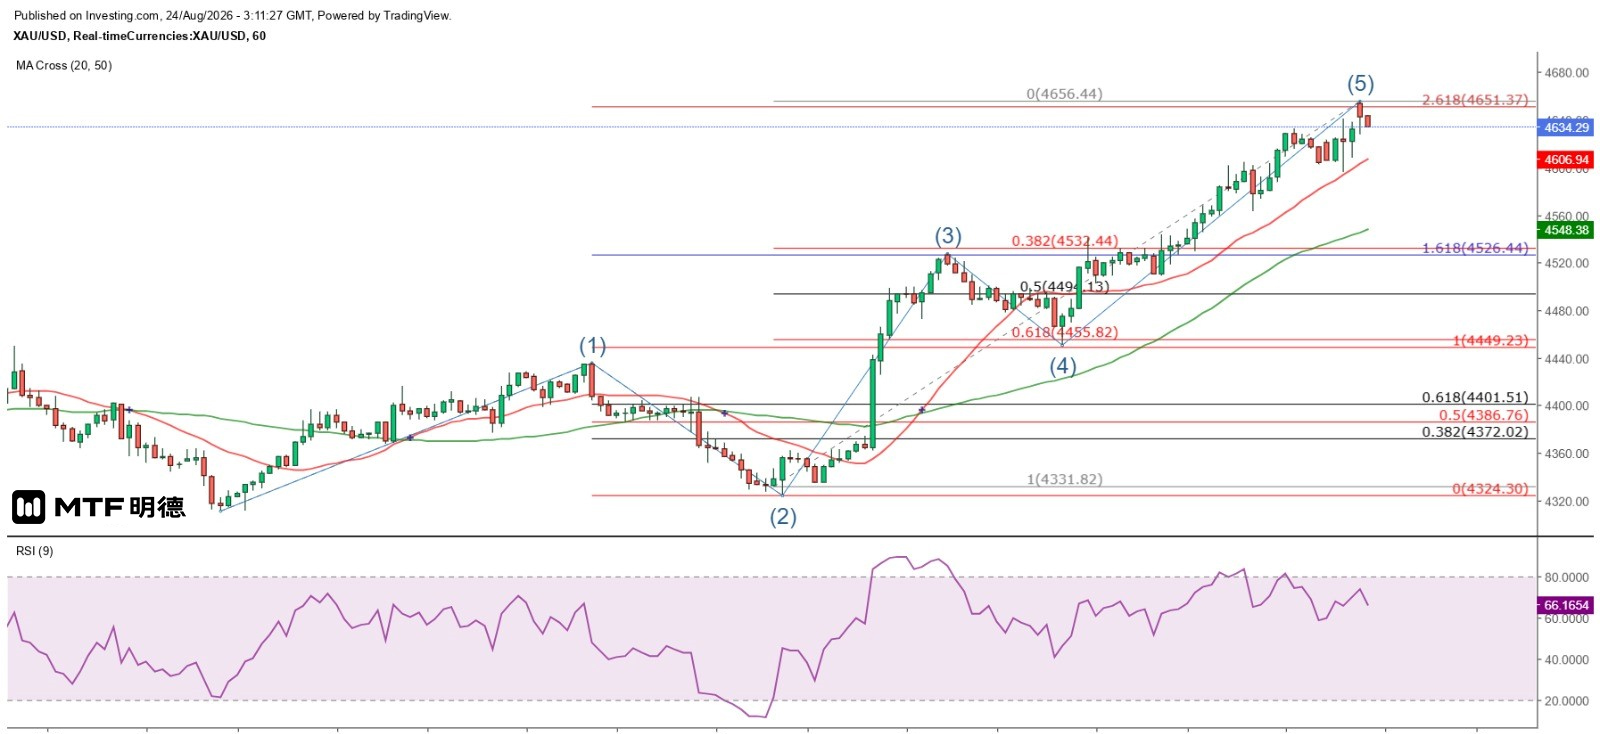
"Gold Price Correction Wave May Test 4,450 USD" – Completed on August 24, 2026, 11:11 AM The impact of the U.S. Treasury's announcement to increase the purchase of long-term government bonds continues to unfold, pushing gold prices higher. As expected, gold rose to $4,600 last Friday and has shown no signs of slowing down. After closing in London at $4,632.24, spot gold continued to climb following a brief dip to $4,595.95 during early Asian trading today, before reaching a fresh recent high of $4,656.44. In the short term, selling pressure on gold is likely to gradually intensify. Technically, the first key resistance level lies at $4,660, aligned with the Gann square angle; beyond that, the Fibonacci 100% extension target from March 23 stands at $4,735.06. On the data front, this Tuesday will bring the latest ADP employment change figures, while Wednesday’s release of July PCE inflation data is expected to draw extra market attention. Current forecasts anticipate year-on-year growth remaining steady at 3.3%. Additionally, the preliminary Q2 GDP reading will be released on the same day, along with a host of other economic data. At this sensitive moment, any single figure could easily become a catalyst for market speculation. The most anticipated event remains the Jackson Hole Global Central Bank Symposium from August 27 to 29. Since new Federal Reserve Chair Waller has broken with past Fed chairmen by refraining from commenting on U.S. economic outlooks after policy meetings and omitting forward guidance in post-meeting statements, and given that U.S. inflation remained above 3% between March and July, market concerns over persistent inflation have led to a weaker dollar and rising bond yields. However, it is certain that Waller will signal a firm commitment to curbing inflation and bringing it back to 2% at the symposium. Judging by his words and actions, I expect him to hint at a possible rate hike in September—only then can long-term interest rates potentially ease after their recent surge. Therefore, from a timing perspective, the current upward momentum in gold is unlikely to extend into next week. First, the two major technical resistances mentioned above pose challenges. Second, analyzing the price action since August 14, the third wave of the rally has already exceeded 2.618 times the length of the first wave, possibly even completing a five-wave structure and entering an ABC corrective phase. Conservatively speaking, gold may retreat to $4,494.13, with further declines potentially breaching $4,450. Nevertheless, support is expected to hold above $4,410, allowing for consolidation before resuming an upward trend. The above information is for reference only and does not constitute investment advice.


