
 en-US
en-US 

 Telegram
 WeChat

2025-10-21
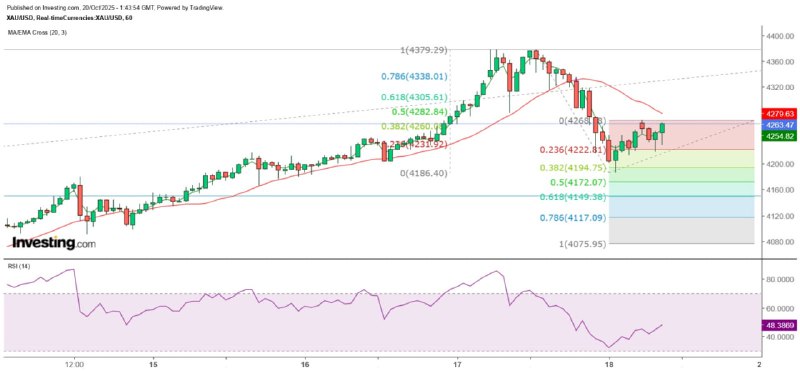
"Gold Price Short-Term Rebound Expected to Be Capped at 4280" 20/10/2025 9:39 Completed As the saying goes, "The good ones don't work while the ugly ones do." After the spot gold price approached $4,380 in the Asian market last Friday, it failed to maintain its strength and break through the psychological threshold of $4,400 in the European market. Instead, it dropped sharply in the early afternoon of the Tokyo market after reaching a high of $4,378.73 (the early high was $4,379.29) in a double top formation. Given the gold price's inertia over the past period, it would usually rebound significantly and even reach new highs after the European market opened. However, the gold price remained weak throughout the first half of the European market, leading me to conclude that the correction was not over yet. As a result, the gold price plunged to below $4,200 after the London market closed, hitting a low of $4,186.40 before rebounding continuously. The price dropped by nearly $130 throughout the day. Gold prices are trapped at two Gann angles. Has the gold price reached a medium-term peak? From the hourly chart, the double top formation of the spot gold price is extremely obvious. Taking 4279.22 US dollars as the neckline level, the measured decline target of the gold price is 4179.15 US dollars, which is close to the low of 4186.4 US dollars made last Friday. Therefore, the short-term rebound of the spot gold price takes 4279.22 US dollars as the first major resistance. From the Gann Square, 4410 US dollars is located at the 90-degree vertical angle, while 4210 US dollars is located at the 180-degree horizontal angle. Both are strong support or resistance levels. Currently, 4210 US dollars is the strong support and 4410 US dollars is the strong resistance. During the early trading session in Asia today, the spot gold price rebounded to $4,268.18 at one point. However, it fell back in a small double top pattern on the 1-minute chart, reaching a low of $4,219.17 before rebounding significantly. But it was blocked at the $4,250 level and dropped sharply again, stabilizing temporarily at the $4,230 level. Firstly, the current gold price is fluctuating within the Gann Square range of $4,210 to $4,260. Looking at the hourly chart, since last Friday, it has rebounded by more than 41%, slightly more than 38.2%. If it fails to further challenge the neckline of the previous large double top at $4,279.22, the rebound since last Friday will be regarded as a weak rebound, and the price is expected to test the low again in the future. The mid-term adjustment can be seen at $3,845. Unless gold prices reach a new high, even if they break through the neckline of the double top and rebound by 61.8% of the biggest decline since last Friday, it is still possible that the medium-term peak has been reached. The current rally in gold prices began after the Federal Reserve Chair Powell's dovish remarks at the Jackson Hole central bank symposium in late August. Taking the previous low of $3,311.46 as the starting point, the medium-term adjustment target is 50% of the biggest increase since then, which is $3,845.38. The resistance for the day includes the neckline of the double top at $4,279.22 on the hourly chart and the 20SMA on the hourly chart (currently around $4,279.41). If the Fibonacci extension line is used to measure the current hourly chart trend, the 100% extension line for the decline is $4,117.09. In other words, it is expected that gold prices will remain in the range of $4,210 to $4,260 for the time being. The above content is for reference only and does not constitute investment advice. MTF Special Analyst Zheng Guangfu
2025-10-20
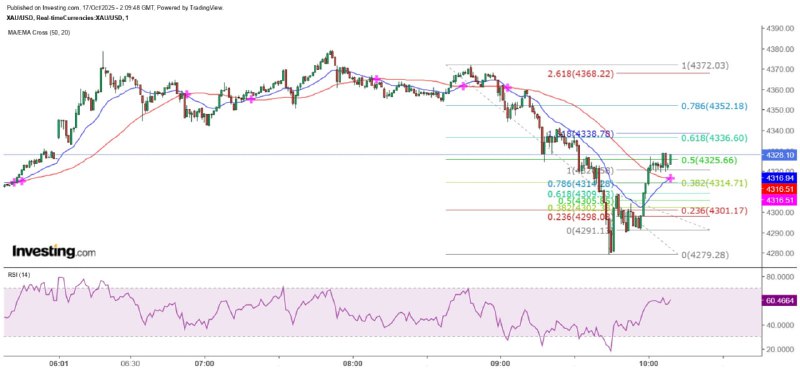
Gold price may challenge $4,410 within the day. 17/10/2025 10:08 Completed. Gold prices continue to reach new highs. When I woke up this morning, I checked the price and found that it had risen to a new level in just a few seconds. It's unknown how many investors have noticed that, from the hourly chart, the adjustment range after each significant rise since October has been smaller than the previous one. For instance, the adjustment range after the rise from October 2nd to 9th was 50%, then it was 38.2% after the rise to October 14th, and only 23.6% after the rise on October 15th (a less commonly used reference range). This seems to indicate that the power of the bears is weakening. The more mountains one climbs, the more likely one is to encounter a tiger. Little did they know that after reaching a new high of $4,379.29 this morning, the gold price plunged again. Technically, the previous few corrections have all found support around the 20-hour SMA (currently around $4,229). The sharp drop this morning has not yet reached that level. From the perspective of investor psychology, the continuous rise in the gold price has been accepted by the market, and even some have the courage to buy at the moment of a new high. If this phenomenon becomes widespread among retail investors, it will be exactly what the big players want. There is no guarantee that one day, investors who bought at the high will think that the gold price will reach a new high and wait for it to return, only to find that it may never come back! Gold prices are expected to break through 4,260 again. In summary, the performance of gold prices cannot be explained by common sense. This morning, the gold price dropped to the $4,279 level and then rebounded. If we observe it with the Gann Square, the current gold price has returned to the range of $4,310 to $4,360. In fact, the high point of the gold price this morning was close to $4,380, but the gold price has closed higher every day. This does not seem to be the result at the end of the day. In other words, the gold price is likely to challenge $4,410 today! I make such a bold assumption based on the performance of the gold price, but does this mean that the gold price is moving towards its ultimate high point further? The above content is for reference only and does not constitute investment advice. MTF Special Analyst Zheng Guangfu
2025-10-17
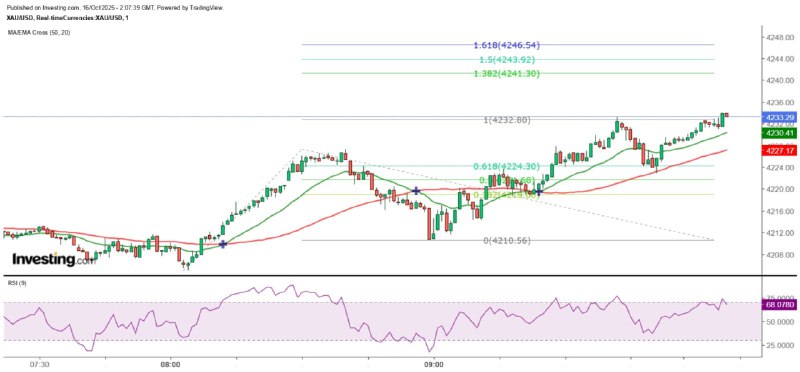
"Gold Price: Resistance at 4210 Turns to Support" 16/10/2025 10:04 Completed It seems that hitting new highs has become a daily occurrence for gold prices. Yesterday, gold prices reversed the significant correction seen on Tuesday. Spot gold dropped sharply near midday in Europe but rebounded strongly after hitting 4165.62 dollars. Technically, it found support at the 20-hour SMA (currently around 4202), and then rose in a volatile manner. It repeatedly tested the 20-hour SMA but rebounded each time, developing in a pattern of higher lows. In the early Asian session today, it even reached a new high of 4227.79 dollars. The release of selling pressure is beneficial to the gold price. The ongoing US-China trade war and Powell's dovish remarks are the main reasons for the continuous rise in gold prices. However, the trade war will eventually be resolved, and the interest rate cut was already expected by the market. It is questionable whether gold prices will continue to rise after the rate cut in late October. However, there is an opinion on the sharp drops in gold prices over the past two days. One is that such a sharp drop has wiped out most retail investors, and after a major adjustment, the selling pressure caused by short-term overbuying has been released, so gold prices can resume their upward trend. The other is that such a sharp drop may be due to large investors selling off their holdings. As the saying goes, the more large investors sell, the higher the price goes. Regardless, the volatility of gold prices is increasing, especially in New York. Investors should manage their risks well. Short-term traders should be cautious of the double top risk. From the Gann Square perspective, the current gold price is in the range of $4,210 to $4,260. Since $4,210 is a strong support (or resistance), if the gold price has held steady at $4,210, there is a high possibility that it will challenge $4,260 in the near future or even within the day. From the 5-minute chart, it can be seen that the gold price has just completed a Fibonacci 100% extension pattern, but after a pullback to the 20SMA, it has found support and resumed its upward trend. Therefore, it is still possible that it will reach 1.382, 1.5 or 1.618 times before a pullback. In the short term, attention should be paid to the gold price rising to $4,233 or the possible double top divergence after breaking through this level. For the time being, $4,222.9 can be regarded as the neckline. Once it is broken, the measured decline target is $4,212.67, which is close to the important support level of $4,210. At that time, the gold price may start to rise again. The above content is for reference only and does not constitute investment advice. MTF Special Analyst Zheng Guangfu
2025-10-16
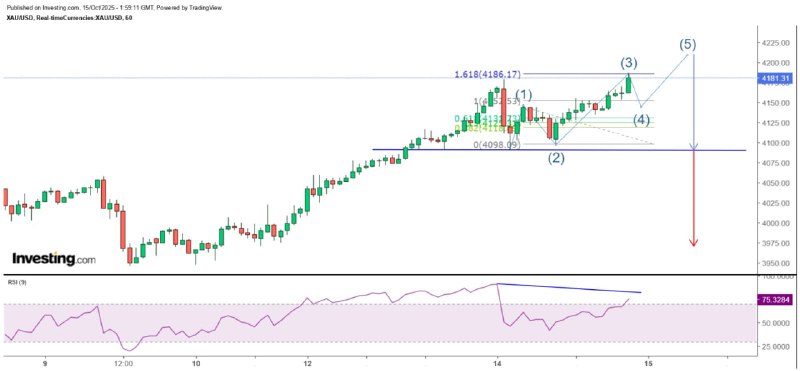
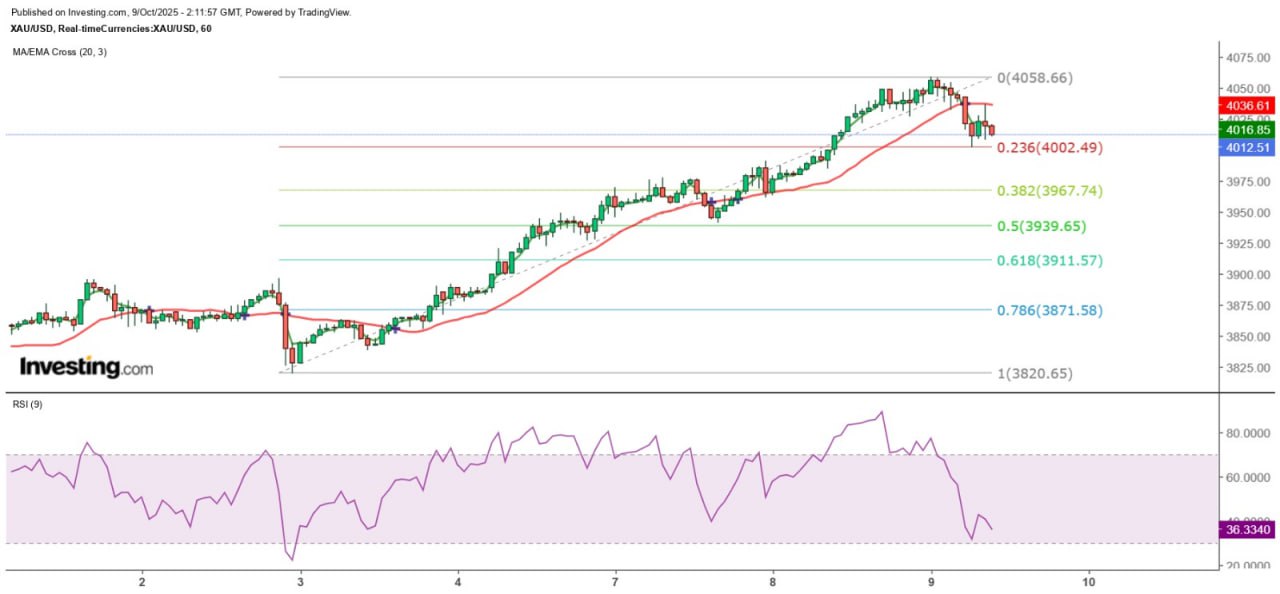
"Gold Price About to Enter a Major Correction Wave" 15/10/2025 9:53 Completed Yesterday, Federal Reserve Chair Powell spoke at the National Association for Business Economics' annual meeting, hinting that the authorities are close to pausing the balance sheet reduction. He said that there are signs that liquidity conditions are gradually tightening, including a general rise in repo rates and more pronounced temporary liquidity pressures at certain times. He emphasized that based on the experience since 2020, the authorities can use the balance sheet more flexibly in the future. He further stated that the measures to reduce the balance sheet in the coming months may be approaching an end and that the authorities remain committed to achieving a balance sheet that holds only Treasury securities over a longer period. The Federal Reserve is expected to end its balance sheet reduction program within the year. Moreover, he also mentioned that the current data indicates that there is a significant downside risk in the labor market, which justifies the rate cut in September. The "equilibrium level" of job creation is highly uncertain and may have dropped to a negative value. He also pointed out that the slow transmission risk of tariffs is beginning to manifest as persistent inflation. His remarks reflect that the risk of stagflation in the United States is increasing. However, since he stated that the authorities are likely to end the balance sheet reduction in the coming months (I believe it is within this year), even if the Federal Reserve does not "expand the balance sheet", it is inclined to maintain the current size of the balance sheet. Gold prices remain resilient. Despite a sharp drop of $89 within two hours at the opening of the European market yesterday, hitting a low of $4,090.67, they rebounded to $4,145.11 before encountering resistance again. It's worth noting that the price dropped once more but only reached a low of $4,098. Subsequently, it rose further. Technically, this not only forms a double bottom pattern but, according to wave theory, also represents a potential second wave. Three waves have reached the target, and there is significant resistance at 4210. Therefore, taking the basic increase of the third wave as 1.618 times that of the first wave, the target is $4,186.17. The high of $4,186.71 reached by gold in the early Asian session today is slightly above the above-mentioned target of the third wave. Therefore, it is inferred that gold will enter a short-term fourth wave correction, with a target close to but above $4,145.11, and then launch the fifth wave. Whether it can break through $4,186.71 or not, an abc correction wave will follow, with a target below $4,145.11. From the perspective of Gann's square, the current gold price has traded above the $4,160 to $4,210 range. If the gold price reaches or approaches $4,210, this level is at the 180-degree horizontal angle, presenting significant resistance. When the five waves of the Elliott Wave Theory are simultaneously fulfilled, the extent of the gold price adjustment will be greater. Coupled with the 9RSI on the hourly chart showing a top divergence, it is estimated that the gold price will at least test the support level of $4,100. If $4,090 is taken as the neckline of the double top, and assuming the gold price peaks at $4,210 and then falls, the measured decline target after breaking the neckline is $3,970. Especially, I judge that the short-term top of the gold price will occur today, and the gold price is about to face a new round of major adjustment wave! The above content is for reference only and does not constitute investment advice. MTF Special Analyst Zheng Guangfu
2025-10-15
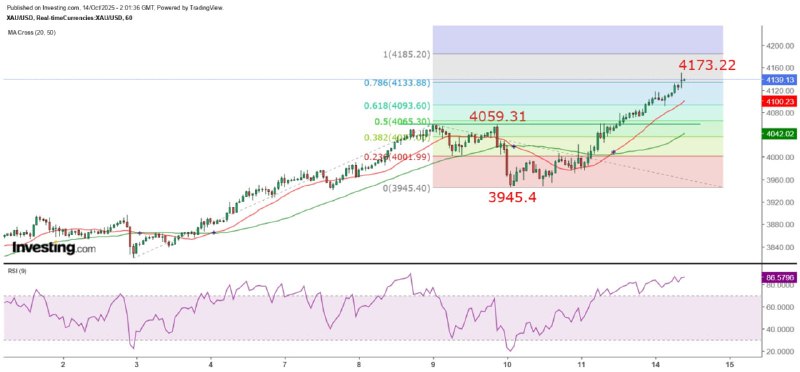
"Gold Price Breaks 4200 in Short Term Unlikely" 14/10/2025 9:58 Completed Just last week, Trump threatened to impose a 100% tariff on Chinese goods. The Office of the United States Trade Representative also announced a Section 301 investigation into China's shipping industry not long ago. However, yesterday, Trump changed his tune, saying that he was just having a moment of emotional outburst. He doesn't want China to fall into depression and the United States wants to help China rather than hurt her. On the other hand, Beijing also stated that the export restrictions on rare earths and related equipment are not a complete ban and the impact on the global industrial chain is extremely limited. A daily fluctuation of over 100 points seems like a delivery price. However, gold prices continued to hit new highs regardless of whether they were considered a safe haven or not. After breaking through the $4,130 mark this morning, they pulled back to the $4,119 level where they found support. In the early Asian session, they once again pushed higher, reaching a temporary high of $4,149. It's worth noting that gold prices rose by more than $100 yesterday, with spot gold climbing by nearly $114 and the most active December gold futures on CME rising by more than $111. The sudden and significant expansion of the intraday gains in gold prices, with a daily swing of over $100, is the first time since the large-scale upward trend began in late August, and it has a strong flavor of year-end profit-taking. However, Bank of America expects the gold price to rise to $5,000 per ounce before 2026. In fact, not to mention a single-day increase of over $100, even at an average daily increase of $50, the target can be reached within 20 trading days. Michael Widmer, the head of commodities strategy at Bank of America, said that if investment demand increases by 14%, the gold price could challenge $5,000, and if it increases by 28%, it could even challenge $6,000. Is the current gold price high or low? When you look down, the gold price is at a high level; when you look up, it is at a low level. Cao Runchao once said, "It's better to follow the trend than to be wise." Whether it's a threat or an opportunity can only be known after the fact, but only by entering the market can one determine the outcome. Talking on paper is just a waste of time! The 20-hour SMA must not be violated. Based on the hourly chart analysis since October 2nd, the second round of the gold price rally that began on October 10th, if the increase is the same as the previous rally, it could reach $4,185.2. If the gold price broke through the resistance level of $4,059.31 on October 13th, the measured upward target would be $4,173.22. In other words, the short to medium-term chance of the gold price breaking through $4,200 is not high. Regarding the moving average lines, the 20-hour SMA (currently around $4,096) is a clear strong support. Once it closes below this line for three consecutive hours, it is expected that the gold price will undergo a deep adjustment, with a temporary downward target of $4,047. The above content is for reference only and does not constitute investment advice. MTF Special Analyst Zheng Guangfu
2025-10-14
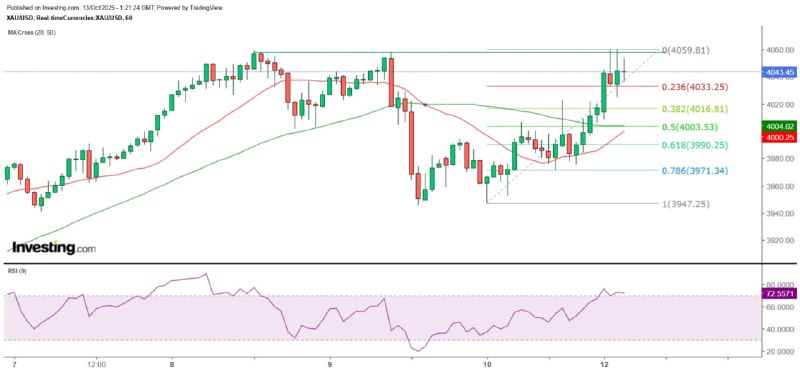
"Mid-Term Top Signal for Gold Price Remains Valid" 13/10/2025 9:15 Completed The partial shutdown of some US government departments for nearly two weeks has forced about 750,000 civil servants to take unpaid leave. Economists estimate that this shutdown has caused about 6 billion US dollars in productivity losses and contract delays each week. The Democratic Party of the United States demands to extend the subsidies of the Affordable Care Act, which will expire on December 31, 2025, but the Republican Party insists on passing the appropriation bill first and then discussing other matters. So far, the two parties have not reached a consensus. Last Friday, the gold price continued to rise, following the upward trend of the previous day. The spot gold price in New York City continued to climb and finally returned above the 4,000 US dollar mark, closing at 4,017 US dollars. The trade friction between the United States and China influences the gold price. Gold prices have rebounded sharply, which is believed to be related to the renewed escalation of trade frictions between the United States and China. After China announced extensive global export controls on rare earth elements, the Trump administration retaliated. The Office of the United States Trade Representative announced the final measures of the Section 301 investigation into China's maritime, logistics and shipbuilding sectors. Among them, the measure of imposing port fees on relevant Chinese vessels will be officially implemented on October 14. In terms of geopolitics, NATO announced on Friday that it would start nuclear exercises this week, with more than ten countries and dozens of aircraft participating. NATO stated that the exercise is not targeted at any country or event. NATO officials said that the exercise will simulate scenarios where nuclear weapons might be used, but the weapons and equipment used in the exercise do not include nuclear weapons. On the other hand, the Russia-Ukraine war is still ongoing. Both sides are attacking each other's energy facilities. Russian oil refining facilities have become targets, while Ukraine's natural gas production facilities and energy infrastructure have also been damaged. There is significant resistance at $4,060 in the short term. Last Friday, spot gold prices found support at $3,945 and have been rebounding since. This morning, they rose sharply on the backdrop of escalating trade tensions between the US and China. In the early Asian session, they reached a high of $4,059.81 and then pulled back significantly to $4,024.77 before climbing again to $4,059.71, forming a double top pattern technically. From the hourly chart, it is evident that gold prices are encountering strong resistance at $4,060. Therefore, if gold prices break above $4,060, a sharp rally is likely. Currently, gold prices are still trapped between $4,010 and $4,060. The 1-minute chart is forming a double top pattern, and with the neckline at $4,024.77, a break below this level could see gold prices fall to $3,989.73 before stabilizing. Additionally, from the daily chart, the double-day reversal pattern that emerged on October 9th remains valid until gold prices close above $4,058.09 on the daily chart, indicating a medium-term top. The above content is for reference only and does not constitute investment advice. MTF Special Analyst Zheng Guangfu
2025-10-10
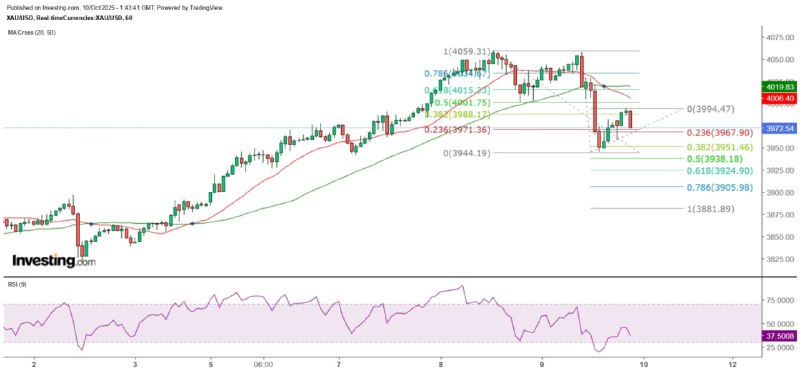
"Is the Gold Party Over?" 10/10/2025 9:41 Completed Yesterday, the gold price closed with a single-day reversal and a near bearish engulfing pattern on the daily chart, and the intraday movement was extremely volatile. Spot gold rebounded continuously from the low of $4,001.75 in the early Asian session yesterday until it reached a high of $4,057.98 just before the London close, which was also the highest point of the day. Subsequently, the price of gold plunged sharply, with a decline of over $40 within the first hour. After breaking below $4,000, the decline intensified, and even the psychological support level of $3,950 was briefly breached, hitting a low of $3,945.40. The rebound began after the 9RSI on the hourly chart dropped below 20. $4,000 turns back into resistance. From the hourly chart, the gold price showed a very strong piercing pattern one hour after the London market closed. Investors also noticed that since October 7th, its trend has formed a large double top pattern, with the neckline being the low point of 4001.75 dollars made in the early Asian session yesterday. The measured decline target after breaking the neckline is 3944.19 dollars, and the low point of 3945.4 dollars made by the gold price yesterday is very close to this level. In other words, the significant adjustment of the spot gold price yesterday was technically completed in one step, and the possibility of a short-term rebound is relatively high. The severe overbought condition remains unchanged. However, the double top neckline at $4001.75 becomes the main resistance for the rebound. Moreover, the single-day reversal pattern on the daily chart also indicates that the possibility of gold prices reaching new highs is extremely slim. Additionally, although the maximum decline in gold prices yesterday was $112.5, the 9RSI on the daily chart still exceeds 73, and the weekly and monthly charts are respectively above 87 and 94. Therefore, the adjustment in gold prices is at most just the beginning! Short-term fluctuations within $200. In the early Asian session today, the gold price rose as high as 3995 US dollars, but was clearly blocked near the 4000 US dollar mark. If the movement since yesterday's high is measured by the Fibonacci extension line and the 100% extension is taken into account, the gold price will fall to 3881.89 US dollars. Currently, it seems that 4000 US dollars has changed from support to resistance. From the perspective of Gann's square, the gold price will fluctuate between 3960 and 4010 US dollars. If it breaks through 3960 US dollars, the gold price will drop to the next level, fluctuating between 3910 and 3960 US dollars. However, the support at 3910 US dollars is not very strong, and the stronger support is at 3810 US dollars. Therefore, for a period of time, the gold price is likely to fluctuate between 3810 and 4010 US dollars. The above content is for reference only and does not constitute investment advice. MTF Special Analyst Zheng Guangfu
2025-10-09
《金銀小時圖呈轉跌跡象》9/10/2025 10:10 完稿 金銀價格繼續創新高,金價近期表現固然矚目,白銀價格更在昨天倫敦收市後升至逾49.54美元新高,突破了1980年1月18日的高位49.45美元。白銀會否形成超大型頂形態,還是破頂而上?以目前金價比率仍處於82倍的高水平,銀價明顯落後於金價,兩者走勢完全相反當然可令金銀比率怏速向下修正,但這可能性極微,而目前兩者表現強橫來看,同步上升,而銀價升幅較金價大是較為合理的推斷,如此,銀價突破46美元及進一步挑戰高位的可能性較大。當然,投資者亦不能忽視金銀價格同步下跌的風險。 金價4000美元成新支持 金銀價格在昨天紐約午市開始力弱,並雙雙從高位大幅回落,金價在今早亞洲市低見4001.75美元後再度攀升,早段曾高見4036.42美元。由此反映,4000美元已成為金價新的強支持位,其次就是金價目前處於江恩正方形4010至4060美元波動。不過,投資者亦須注意,金價在小時圖已連續5小時收低於20SMA(4037.45),是10月3日以來最長時間,該線視為短期反彈阻力。 銀價短線阻力49.2美元 此外,從小時圖觀察,金價已連續6小時收低於20SMA(4036.6),是上周五以來最長的一次,故投資者仍不應忽視其可能已開始轉趨下行的可能,如後市反彈至20SMA明顯受阻,並再度回落,並失守4000美元,則轉跌的可能性大增,初步下跌目標為3910美元,該位約為上周四以來最大升幅的61.8%調整水平。至於銀價方面,由昨晚開始累計的調整幅度接近本周二以來最大升幅的50%(48.44),故繼續守穩在48.44美元以上,銀價有望維持目前的升勢,惟短線料於49.2美元有一定阻力。 以上內容僅供參考,不構成投資建議。 明德特約分析師 鄭廣復
2025-10-08
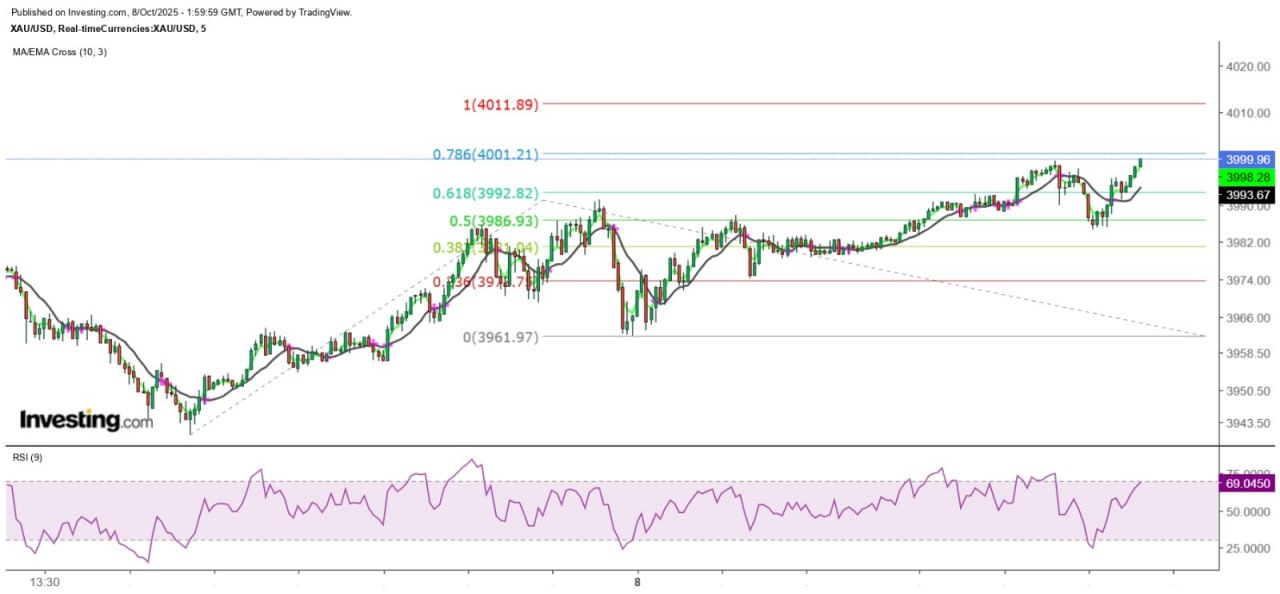
《金價迫近被高估的水平》8/10/2025 10:01 完稿 昨天金價再創新高,但全日走勢極之波動,半小時內波幅可以達到25至30美元。期金率先突破4000美元關口,最活躍12月期金最高升至4014.6美元,現貨金價在接近倫敦收市前升至3991美元,但隨後持續回落,最低跌至3962美元,但之後再度攀升,並曾突破3980美元,由此可見,金價波動性極高。 金價表現如此強勁,與美國貨幣供應大幅增加相關,尤其在2019年全球疫情大爆發,各國央行大幅減息兼大量增加貨幣供應,以聯儲局為例,其資產負債表在2019年8月約為3.76萬億美元,急增至2022年5月的8.96萬億美元,雖然其後持續縮減資產負債表,但截至今年9月30日,規模仍然接近6.6萬億美元,仍較疫情前的水平超過75%! M2與金價比率降至6水平 當然,我們亦應理解,聯儲局不可能話收就收,等待債券到期需要時間,強行在二手市場拋售必會造成債息急升,對美國經濟更加不利。美國結束減息周期,如掉頭加息及加快縮表速度,M2貨幣供應減少,金價就會較快回落。美國 M2與黃金的比率在1970 年代初期高達約 17倍, 第二個高位則在 2000 年初的約 20倍,這顯示當時黃金被低估。相反,該比率在1980 年時降至接近 2倍,而在1987及2011年亦曾降至6倍以下,反映金價在該時期被高估。M2與黃金的比率在今年8月(最新)降至6.47倍,預示金價正邁向被高估的水平。 金價4010美元為強阻力 金價在今早亞洲市衝高至3999.35美元,在不到2分鐘內急跌跌3990美元,其後反彈再跌,低見3984.6美元後再反彈,最終曾高見4000.97美元。目前金價在江恩正方形的3960至4010美元區間波動,而4010美元位於90垂直角,阻力極大,故留意金價即使突破4010美元,跌返4000美元以下的可能性仍然極高。另外要留意,昨天金價曾跌穿小時圖20SMA(現約3983.6美元),低位與該線的距離曾逾20美元,故金價若在小時圖收低於20SMA,仍將視為轉跌訊號。目前金價日線圖9RSI已升至89,在月線圖上更達到94,反映金價已嚴重超買,留意急跌風險。 以上內容僅供參考,不構成投資建議。 明德特約分析師 鄭廣復
2025-10-06
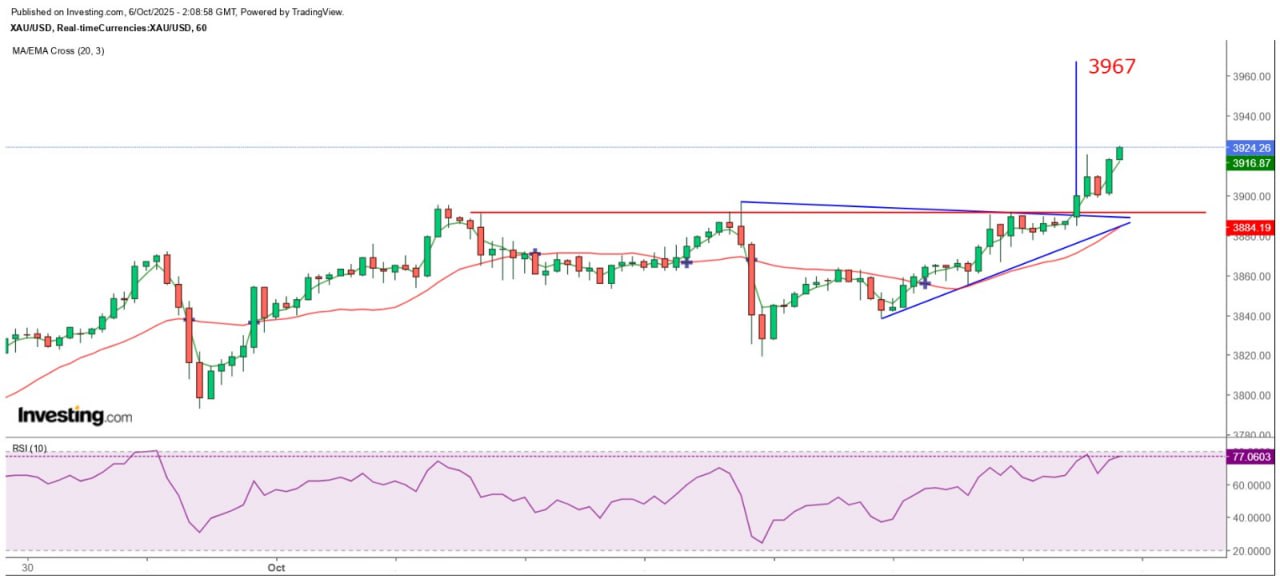
《金價4000美元目標在望》6/10/2025 10:05 完稿 美國政府部分部門停運,導致美國勞工部未能如期在上周五公布9月非農就業報告,原訂在本月中公布9月CPI亦很可能要延後公布。金價則繼續創新高之旅,上周五大致在3877至3891美元的相對高位橫行,今早在亞洲開市初段發力狂飆,最低但見3884.5美元,其後突破3900美元,高見3920美元水平後才略為回調,但低位僅輕微試穿3900,高低差距拉闊至35美元,調整後再發力,迫近3925美元。 從過去一段時間的走勢判斷,金價在亞洲市早段已有如此強勁的表現,歐洲開市後料進一步攀升,再以金價的平均每日約50美元波幅計,日內可升至3935美元。另一方面,從江恩正方形觀察,現貨金價今早的高位已突破了3860至3910美元波動區,由於3910美元位於45度角,故屬於阻力較小的價位,3960美元亦非重要阻力或支持位,金價如可站穩3910美元,下一個挑戰的目標將是4010美元。 3900美元成為諮整支持 以TD線量度小時圖的走勢,今早金價有效突破TD下降軌阻力,量度目標約為3967美元,與上述提及的3960美元非重要阻力高7美元,有機會造就一次正常的回調,但小時圖的大雙頂(高位約為3897美元)已遭到突破,故即使出現調整,預料3900或3910美元將成為強力支持,要扭轉金價的升勢,則必須跌穿今早的低位約3884.5美元,但相信可能性極微。 價格傾向沿趨勢發展 引用20世紀初的著名投機者Jesse Livermore其中一句名言:大意是價格會找尋容易的方向發展,除非遇到一股最初不被察覺,但慢慢發展成為無法抵擋的阻力,價格才會逆轉。或許有投資者感到疑惑,金價要繼續創新高,即上升空間不確定,那不是比下跌更難嗎?實際上,他的意思是價格傾向原有的方向發展,而不會無端反其道而行。我仍然強調,金價已極度超買,但金融資產價格達到某個程度時就屬於非理性,目前金價顯然就是處於這個階段。 投資者應如何應對?我再引用二十多年前看過一個形容金融市場的故事。兩人不斷以更高的價格與對方買賣一罐沙甸魚。 某天,A對B說:「糟了!這罐已經過期!」 B輕描淡寫地答:「那有何相干,我們只是在進行交易而已!」 祝各位中秋節快樂! 以上內容僅供參考,不構成投資建議。 明德特約分析師 鄭廣復
2025-10-04
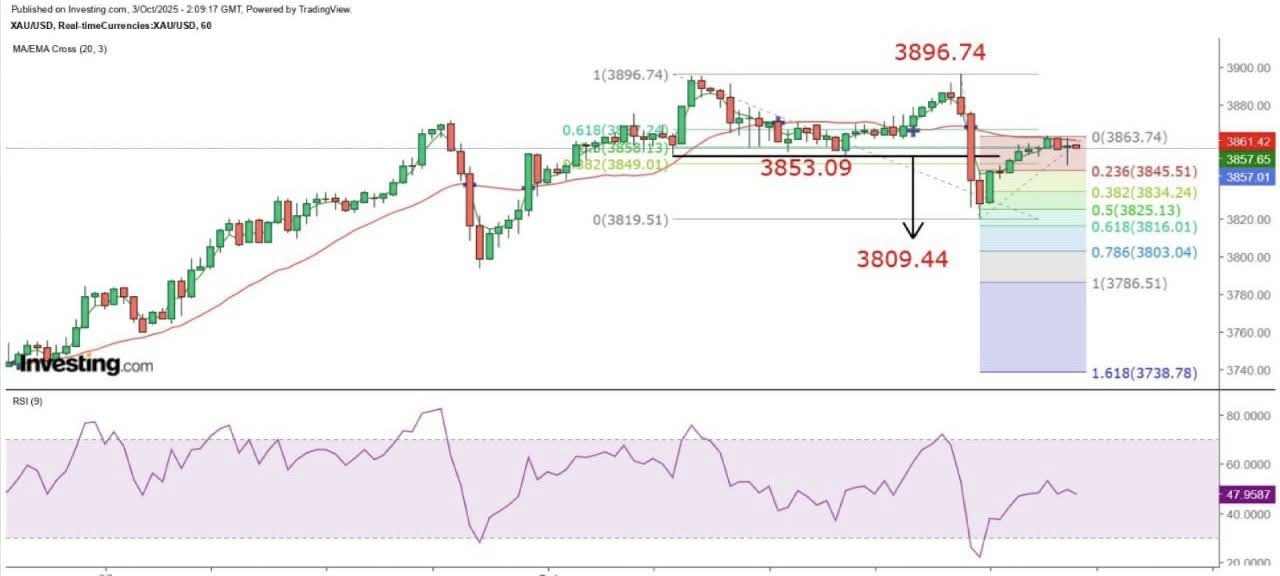
《金價短期料繼續調整》3/10/2025 10:05 完稿 投資黃金真的是考驗投資者的意志力及耐性,現貨金價昨天在紐約市早段再創歷史新高至3896.74美元,這次衝高後亦如9月30日般急轉直下,但跌勢之急有過之而無不及,最終在跌至3819.51美元後才出現較大的反彈。金價在紐約市表現高台跳水沒有特別原因,極其量是怪責民主黨參議員並未支持共和黨的撥款議案,導致美國聯邦政府一些部門停運,許多經濟數據都不能按原訂時間公布,金價炒高後缺乏數據支持,而在亞歐兩市已累積了數十美元升幅,炒家自然會獲利盤拋售,引發金價急跌。 小時圖20SMA阻力大 今天在現貨金價在亞洲早市高見3863.74美元後受阻,從小時圖可見,金價在20SMA(3861.53)明顯遇到阻力,而金價的高位剛好通於昨天最大跌幅反彈50%至61.8%之間,而20SMA略高於3810至3860美元的江恩正方形波動區上限,故金價短期須重新守穩小時圖20SMA才有望進一步上升,此外,重返3860美元以上,預示金價再次返回3860至3910美元的高一級波動區。 金價可跌至3786美元 不過,投資者須注意,金價月線圖9RSI仍超過92,反映金價嚴重超買程度並未改變,而在美國聯邦政府停運期間,金融市場缺乏數據去判斷經濟表現,金融資產價格將受到消息主導,預料波動性將會更大。以費波納奇擴展線從小時圖量度昨天以來的走勢,若第二段跌幅與昨天最大跌幅相同,金價將跌至3786.51美元,以目標金價的日內波幅每每達到50至70美元計,絕對可以跌至該位,但考慮到下跌過程會出現另一些技術支持,故金價或會在3825、3816、3810及3800美元稍作停留,甚至出現短暫反彈後再下跌。 以上內容僅供參考,不構成投資建議。 明德特約分析師 鄭廣復
2025-10-02
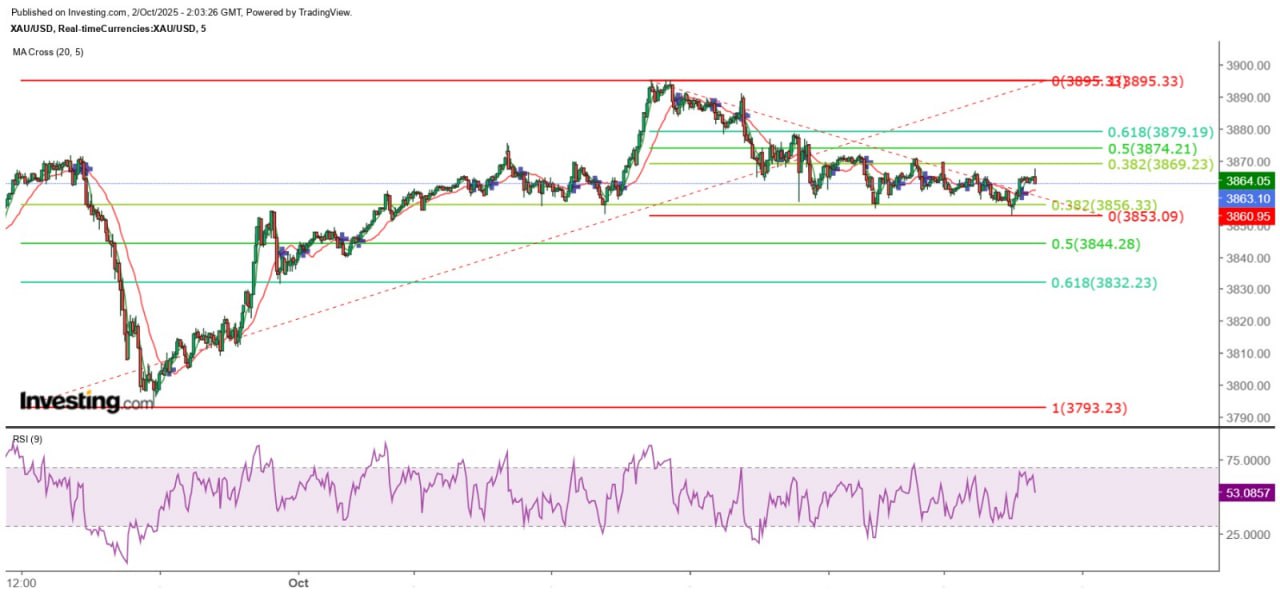
《金價短線反彈料受制3880》2/10/2025 10:00 完稿 金價在第三季最後一個交易日出現單日轉向強烈轉勢訊號,現貨金價在本周一歐洲開市時高見3871.72美元後掉頭急跌,接近歐洲午市跌穿3800美元關口,低見3793.23美元,其後反彈,最終高收於3862.95美元。美國參議院在本周二否決了民主黨提出的撥款法案,導致部分聯邦機構自10月1日起停運,相信金價急跌是投資者先行反應所造成。 昨天為第四季首個交易日,金價在亞洲市早段維持在3850美元以上反覆上落,但在倫敦開市後急升,最高升至3895.33美元,但隨後再度大跌,在紐約市早段低見3857.28美元後才略為回穩,倫敦收市後大致維持在3870美元水平徘徊。 ADP就業職位減少3.2萬 市場觸覺敏銳的投資者應發現,金價本周以來極其波動。尤其昨天美國私營機構ADP公布9月私營企業就業職位減少3.2萬個,數據除差過市場預期的增加5.2萬個之外,亦是6月減少3.2萬個以來第二個月減少,數據強化了市場對美國勞動市場轉差,甚至經濟步向衰退的想法,而這亦令聯儲局在本月減息的機率大增。然而,金價在數據公布後反覆下跌,至紐約午市低見3855美元水平後才反彈,惟無改10月1日高見3895美元後,在5分鐘圖展開的下跌趨勢。 金價短線有機會下試3844 現貨金價在今早亞洲市早段低見3853美元後反彈,最高升至3865美元。從5分鐘圖觀察,金價昨天以來的累計調整幅度,約為9月30日以來最大升幅的38.2%(3856.33),我將其稱為強勢調整,即5分鐘圖的上升趨勢未遭到破壞,後市能否再創新高則是另一回事。若從小時圖觀察,金價仍低於20SMA(3870.75),故須重新守穩該線才有望進一步攀升。短線而言,隨著金價波動性加劇,且走勢偏弱,保守估計,3875至3880美元將成為金價日內主要阻力,且仍有可能調整過去兩日最大升幅之50%,即有機會測試3844.28美元支持。 以上內容僅供參考,不構成投資建議。 明德特約分析師 鄭廣復
2025-10-01
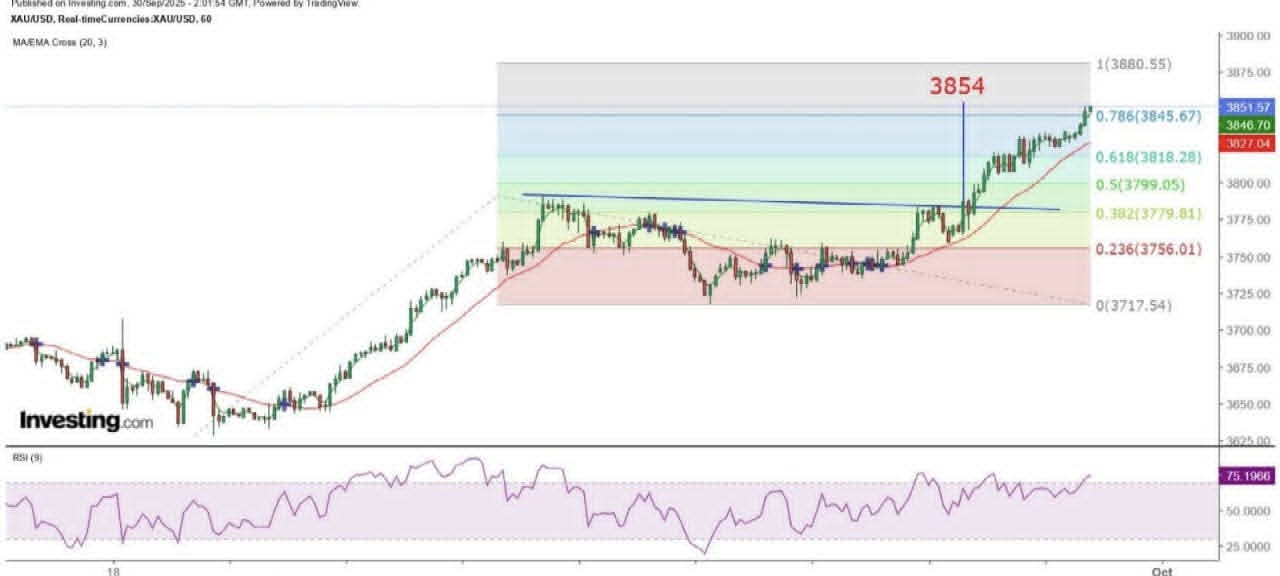
《金價或見3880美元才回調》30/9/2025 10:01 完稿 金價再創新高,現貨金在昨天紐約市高見3833.55美元,CME的10月期金最高則升至3827.6美元,呈現低水,是否預示金價觸頂值得留意。金價再創新高或與美國政府部門面臨停運有關,美國國會如未能通過撥款法案,聯邦政府或在10月1日的新財年首日部分停運。目前共和黨僅以53個議席控制參議院,但需要60名參議員支持才可通過撥款法案,共和黨敦促民主黨先支持臨時撥款以爭取時間,民主黨則堅持撤銷近期削減的醫療補助措施,如此有可能導致非必要的聯邦政府部門最快在周二午夜停運。 停運或令金融市場加劇波動 美國勞工統計局表示,在政府停運期間不會發布經濟數據,受影響的包括首次申領失業救濟人數、每月就業報告、貿易收支、消費者物價指數、生產者物價指數及零售銷售。失去這些經濟數據作為經濟表現的參考指標,金融市場的波動性或因此而加劇。然而,撥款或調高發債上限法案的投票,已成為民主共和兩黨作為爭取通過某些議案的工具,但不論如何,最後還是會通過,若然金價真的因此而借勢夾上,最終很可能因為相關法案通過而急跌,當然它亦可以借其他因素繼續攀升,例如聯儲局傾向進一步減息。 昨天倫敦收市後,現貨金價未見大幅調整,反而在3822美元以上徘徊,其後向上突破3835美元阻力,今早最高升至3850.9美元後遇到阻力,但回調幅度不大。首先,從金價在江恩正方形的價格發展來看,目前仍處於3810至3860美元區域上落。從小時圖觀察,金價近期的升浪由9月18日低位3628.09美元展開,9月23日高見3791.1美元後回落,並於9月25日低見3717.54美元,之後展開第二段升浪。 3800美元成為新底部支持 以費波納奇擴展線量度,如兩段升浪幅度相同,則金價升至3880.55美元後才會展開新一輪調整浪,如此,金價將突破上述的江恩正方形3810至3860美元交易區,但亦無須驚訝,昨天金價波幅就接近77美元,只是投資者須注意,金價迫近或達到3880美元後,大幅回調風險極高。短線而言,估計3835、3810及3800美元將成為金價短期調整的主要支持位,而3800美元更已成為金價新的底部支持。 以上內容僅供參考,不構成投資建議。 明德特約分析師 鄭廣復

2025-09-30
"Gold Price Sideways at Short-Term High, Awaiting Breakout" 29/9/2025 9:28 Completed Last Friday, the spot gold price finally broke out of the narrowing triangle. The US announced that the PCE in August rose by 2.7% year-on-year, slightly higher than 2.6% in July, while the core PCE rose by 2.9% year-on-year, both in line with market expectations. After the release of the data, the gold price did not show a significant reaction. It then broke out upward, reaching an intraday high of $3,766.28 and further climbing to a high of $3,783.78. However, it failed to reach a new intraday high and retreated in the New York midday session, eventually closing below $3,660. Silver outperforms gold. Although gold prices have clearly encountered resistance at high levels, the holdings of the SPDR Gold ETF broke through the 1,000-ton mark last week and increased by another 8.87 tons on Friday, reaching 1,005.72 tons. This may indicate that despite the recent sharp decline in gold prices, there has been no panic selling, and some investors have taken advantage of the lower prices to buy. However, silver performed even better, with the December settlement of silver futures rising by 8.62% for the entire week, while the December settlement of gold futures only rose by 2.78%. This reflects that the gold-silver ratio is further correcting, and it has now dropped to 81.7, far below the highest level of 107 in April, but it still remains at a high level over the past 30 years. Spot gold prices opened higher in Asia today with a gap, and after two hours of consolidation, they rose sharply, reaching a high of $3,788.86, approaching the historical high of $3,791. However, they then dropped sharply. From the 5-minute chart, it can be seen that after the price surge, a bearish engulfing pattern emerged, indicating heavy selling pressure near the historical high and the psychological level of $3,800. From the hourly chart, the 20SMA ($3,763.5) is expected to provide support, but gold prices also formed a double top pattern, with the bottom support at $3,717.5. Therefore, it is judged that gold prices will remain in a range of $3,760 to $3,810 in the short term. However, if it breaks below $3,760, it is expected to return to a range of $3,710 to $3,760. If $3,710 is breached, the measured decline target is $3,644. The overbought condition of gold prices has intensified. Of course, once the gold price breaks through $3,800, it is likely to form a new bottom above that level and prepare for further upward movement. Currently, the volatility of the gold price has intensified, so investors should be prepared for both scenarios. Additionally, apart from the 9RSI on the monthly chart of spot gold rising above 93, the 9RSI on the quarterly chart of futures gold has also reached 91. Therefore, there is still a risk of a sudden sharp decline in the gold price without warning. The above content is for reference only and does not constitute investment advice. MTF Special Analyst Zheng Guangfu

2025-09-29
"Gold Prices Have a Greater Chance of Breaking Downward" Completed on 26/9/2025 at 10:01 Gold prices yesterday mainly showed a pattern of rising first and then falling. After reaching a high of $3,761.65 in the early European session, they dropped again. The final reading of the US second-quarter GDP was revised significantly downward, growing at an annualized rate of 3.8% quarter-on-quarter. Affected by this data, gold prices plunged sharply from the $3,750 level, hitting a low of $3,722.25 before gradually recovering. In the late New York session, they rose sharply to $3,758.36 before falling back. Despite the strong growth of the US second-quarter GDP, it did not change the market's expectation that the Federal Reserve would cut interest rates by 25 basis points in October. CME's interest rate futures indicated that the probability of a 25 basis point cut in October was over 85% as expected by investors. US PCE data may be the breakthrough point. This morning, Japan released its September CPI figures. The overall year-on-year increase remained at 2.5%, and the increase after excluding fresh food also stayed at 2.5%, lower than the expected 2.8%. After the data release, the gold price fluctuated upward, reaching a high of $3,753.4, but then dropped sharply by more than $10 to a low of $3,738.88. The gold price has failed to reach a new high for two consecutive trading days. From the hourly chart, it is clearly visible that the gold price has recently shown a pattern of falling first and then consolidating, with the range of fluctuation between $3,717 and $3,762, roughly within the Gann angle levels of $3,710 to $3,760. Today, it is necessary to pay attention to the release of the US August PCE. It is expected that the overall year-on-year increase will be 2.7%, higher than 2.6% in July. The core PCE is expected to maintain a year-on-year increase of 2.9%. It is believed that the gold price will break through the above sideways range with the data. Currently, the gold price is more sensitive to unfavorable data or news. If the PCE data reflects an increase in inflationary pressure in the US, the gold price is likely to fall below $3,710 and return to the range of $3,660 to $3,710. The short-term downside target is $3,685. In the short term, looking at the hourly chart, gold prices have repeatedly challenged the 50SMA (3750.18) yesterday and this morning but have been clearly blocked. The 20SMA (3745.3) also fell below the 50SMA on Wednesday night. Therefore, it is expected that the probability of a downward breakthrough is relatively high. Measured by the TD line, if it breaks through the ascending track of about 3725 US dollars, the measured decline target is 3685 US dollars, which is slightly lower than the 61.8% adjustment level of the maximum increase from September 18th to 23rd. At that time, it is very likely that the gold price will return to fluctuate within the range of 3660 to 3710 US dollars. The above content is for reference only and does not constitute investment advice. MTF Special Analyst Zheng Guangfu

2025-09-26
"Gold Price May See Strong Rebound Only When It Hits 3,690" 25/9/2025 9:45 Completed The volatility of gold prices is increasing and becoming more one-sided - downward. Investors need not doubt whether the gold price is "dry falling", because there is no price without volume. Looking further back, such a large fluctuation naturally reflects that a large amount of funds are trading. According to an expert with over 40 years of experience in gold trading and research, the gold price is no longer simply influenced by the supply and demand of gold, but is driven by a large amount of funds flowing into the gold market. It can be imagined that the higher the gold price rises, the more hedging actions gold merchants will take. Unfortunately, under the pursuit of a large amount of funds, the gold sold by gold merchants cannot meet market demand, and the gold price is thus pushed up. Speculators began to take profits and exit the market. However, after hitting a record high of $3,791 at 5 p.m. on Tuesday, the spot gold price has been on a downward trend. Yesterday, the spot gold price reached a high of $3,779.33 in the early trading session in London but then weakened. In theory, gold dealers would continue to sell at high prices, but the buying support was clearly insufficient. Not only did the gold price continue to fall, but it also failed to stabilize at a certain level. This leaves only one possibility: gold market speculators have also begun to take profits and exit the market! After the opening of the New York market yesterday, the decline in the gold price intensified. It hit a low of $3,717.54 in the late trading session in New York before gradually recovering. Gold prices are constrained by the 20 SMA on the hourly chart. From the hourly chart, the recent gold price rally began last Friday and ended on Tuesday this week. So far, the maximum decline has exceeded 38.2% (3728.83) of the rally but has not reached 50% (3709.6). The gold price started a rebound wave in the late New York session yesterday and reached a high of 3751.57 dollars this morning, slightly exceeding 50% (3748.44) of the maximum decline since yesterday. It was clearly constrained by the 20SMA on the hourly chart (3752.8) and also by the neckline of the double top on the hourly chart. Subsequently, the gold price fell again. Under the influence of multiple technical resistances, the gold price is expected to further test the lower level. Measuring the movement since $3,779.33 with the Fibonacci extension line and calculating at a 1:1 ratio, the gold price will fall to $3,689.89. This level is also the 61.8% retracement target of the rally from September 19 to 23. It is believed that the gold price will find stronger support at this level and is very likely to trigger another strong rebound wave. The above content is for reference only and does not constitute investment advice. MTF Special Analyst Zheng Guangfu

2025-09-25
《金價短期料下試3710美元》24/9/2025 10:09 完稿 昨天金價走勢極之波動,從小時圖觀察,雖然金價在亞洲市上午9時的一小時高見3759美元水平後,在10時出現陰陽燭下跌訊號,但低見3736.88美元後逐步回升,該位僅比20SMA高約2.5美元,反映20SMA的支持力仍然極強。金價隨後屢創新高,在接近歐洲午市時高見3791.1美元,與昨天指出位於江恩水平線的3810美元相差不足20美元。 金價在紐約市的波動性最大,首先是受到美國標普9月PMI表現差於預期的影響,製造業PMI由53跌至52;服務業PMI由54.5跌至53.9,而綜合PMI亦由54.6跌至53.6。金價在數據公布後急跌可以有多種解讀,首先是金價當時處於3788美元的高位,其次是數據反映美國經濟有轉差跡象,衰退風險增加,黃金成為套現工具。第三則是因為PMI仍處於50的擴張水平,金價的避險作用減退。由此可見,金價與基本面沒有絕對的正或負相關性,資金流向主導價格表現。 鮑公言論致金價波動 除此之外,聯儲局主席鮑威爾的發言亦是金價大幅波動的原因。他表示,就業增長似乎過於疲軟,難以維持失業率穩定,勞市場面臨的下行風險上升,若政策過於緊縮,可能對勞動市場造成不必要的衝擊,而私營企業亦指不確定性正拖累經營前景。另外,鮑威爾重申,關稅驅動的價格上升壓力或是短暫的,不會一蹴而就。貨幣政策立場仍保持適度緊縮,具備良好條件以因應潛在發展,但通脹仍處於較高水平,而9月減息後,聯儲局已處於有利地位,過快放鬆政策或令抗通脹任務未能完成。 短期上升趨勢結束 金價方面,預料深度調整即將展開。從小時圖所見,昨天金價在歐洲開市初段急跌,並低於20SMA(現約3770)達逾8美元,是9月18日升破該線以來最大的距離,另一明顯現象是金價其後的反彈皆未能重上該線。今早雖曾高見3371.77美元,並升破20SMA,但隨即呈單線轉向及穿頭破腳形態,反映小時圖20SMA已失守。以9月18日以來的升浪計算,預料金價首個支持位為50SMA(約3743.5),其後則以調整38.2%及50%為下一目標,即分別為3728.8及3709.6美元。3710美元為江恩正方形315度角,亦是前上落區阻力,但若金價未能在3710美元回穩,並重展升浪,反而進一步下跌,則將返回3660至3710美元上落。 以上內容僅供參考,不構成投資建議。 明德特約分析師 鄭廣復

2025-09-24
"Gold Price Peak Is Not Unpredictable" 23/9/2025 10:01 Completed Gold prices have returned to the pattern of setting new highs daily. Yesterday, the full-day range exceeded $65, with an actual increase of $62.87. In the early Asian session today, it broke through the peak again, reaching as high as $3,759.18. There is no need to delve into the reasons for the continuous rise in gold prices. Neither inflation nor interest rates can explain the strength of gold. The only certain and correct answer is the continuous inflow of funds into the gold market, and the reasons why the owners of the related funds invest in the gold market vary. Don't be provoked by the gold price and lose your rationality. Most investors tend to suffer from a fear of heights when facing a repeatedly rising gold price that keeps setting new highs. Even if they are very disciplined and do not trade against the market, they will still be stopped out when the price drops, even if the decline is not significant and the price quickly rebounds. Investors who are still bearish on gold should adjust their mindset. Regarding the current gold price, they should just consider it as a number and not define it as a historical high. Just like an automatic trading system, it only distinguishes between buy and sell signals and takes corresponding actions. It does not consider whether the price is too high or too low. Successful traders are often "inhuman". They never think that the price movement is targeting them and will never be provoked into a retaliatory mentality and lose their rationality. In the short term, gold prices continued to reach new highs this morning up to $3,759.18 before a sharp decline, hitting a low of $3,747.96 and briefly breaking through the 5-minute chart's 20SMA (currently around $3,749.38). Subsequently, gold prices rebounded again. From the 5-minute chart, it can be seen that around $3,749 is the top of the previous consolidation range. As long as gold prices remain above the 20SMA, a sell-off should only be considered if three consecutive candlesticks close below this line and it is confirmed that $3,749 has been breached. From the hourly chart, gold prices still maintain the upward trend that began after the bearish engulfing pattern at 9 p.m. last night, and remain balanced with the 20SMA. If one wants to take a short position, it must wait for gold prices to close below $3,745.88 or clearly break through the 20SMA. The top of the gold price may be formed today. Is the top of the gold price now unpredictable? The Gann Square that I have been using for over 20 years can calculate any level of resistance or support. The previous range of the gold price was between 3,660 and 3,710 US dollars. Since 3,710 US dollars has clearly been broken through, the current range is between 3,710 and 3,760 US dollars. Therefore, the high of 3,759.18 US dollars this morning might be the highest point of the day. Of course, if the gold price clearly breaks through and holds above 3,760 US dollars, the next level of resistance will be 3,810 US dollars. As this level is on a horizontal line, the resistance is relatively greater, and the adjustment range of the gold price at that time will be larger! The above content is for reference only and does not constitute investment advice. MTF Special Analyst Zheng Guangfu

2025-09-23
"Gold Prices Rekindle Momentum for New Highs" 22/9/2025 9:25 Completed Gold prices rose again last Friday. Even though the Federal Reserve's FOMC announced a 25 basis point rate cut on Thursday morning, lowering the target range for the federal funds rate to 4% to 4.25%, in line with market expectations, the latest economic forecast suggested that there was still room for two more rate cuts totaling 50 basis points in the fourth quarter. However, profit-taking selling caused gold prices to fall sharply, but they gradually recovered after hitting a low of $3,628 on Thursday. As I pointed out, after re-establishing a foothold at $3,646, gold prices once again challenged the previous high and closed at the day's high of $3,685.59. Gold prices strengthened further in the early Asian session today, reaching a high of $3,692 before pulling back. However, it found support at $3,686 on multiple attempts to break through. After stabilizing, it climbed again and approached $3,697. The 5-minute chart shows a consolidation pattern at the high level. As gold prices have returned to the other Gann square price zone of $3,660 to $3,710, it is expected to remain within this range in the short term. However, with the possibility of the Federal Reserve cutting interest rates by another 50 basis points this year, gold prices have a reason to reach new highs. 3710 is a short-term resistance level. In addition, the US will release the final reading of its third-quarter GDP on Thursday this week. The expected annualized growth rate is 3.3% quarter-on-quarter. On Friday, the latest PCE data, which is closely watched by the Federal Reserve, will also be released. It is estimated that the core PCE in August rose by 2.9% or more year-on-year, indicating that inflationary pressure in the US remains high. Therefore, it is necessary to be cautious of a major reversal in the gold price trend on Friday. From the hourly chart, it can be seen that the gold price rebounded after hitting a low of $3,626 on September 15th and also rose significantly after reaching a low of $3,628 on September 18th. Measured by the Fibonacci extension line, if the amplitude reaches 100%, the gold price will rise to $3,708.93, which is extremely close to the Gann 315-degree angle at $3,710. Therefore, $3,710 can be regarded as a significant short-term resistance level for the gold price, while the short-term adjustment will have the $3,678 and the 20-hour SMA (currently around $3,668.5) as the main support levels. The above content is for reference only and does not constitute investment advice. MTF Special Analyst Zheng Guangfu

2025-09-22
"Gold Prices Stabilize at 3646, Bounce Expected to Continue" 9:00 19/9/2025 Completed Yesterday, the spot gold price hit a new high and then closed with a bearish engulfing candlestick, a pattern that last occurred on October 31, 2024. On that day, the spot gold price peaked at $2,790.41 and then reversed in a single day, closing lower at $2,743.80 in a bearish engulfing pattern. After that, the gold price fluctuated and declined, eventually bottoming out at $2,536.91 on November 14. On the same day, it rebounded sharply with a long-tailed hammer candlestick, closing at $2,566.19. The next day, after a slight consolidation, it resumed its upward momentum. Although the gold price hit a high of $2,721.43 on November 25 and closed with a bearish engulfing candlestick, this was only a rebound high and not the top of an uptrend. The midline is expected to decline by more than 250 US dollars. Taking the gold price's drop from a high of $2,790.41 on October 31 last year to a low of $2,536.91 on November 14 as an example, it fell by a maximum of $253.5 or nearly 9.1% over 11 trading days. On the day of the high's reversal, the maximum decline was $58.76. In contrast, after reaching a peak yesterday, the gold price dropped by a maximum of only $79.61 within two trading days, with a single-day maximum decline of $62.3. The overbought condition was also more severe. Therefore, unless gold market investors believe that the Federal Reserve still has a 50 basis point interest rate cut space this year and continue to view gold as a safe-haven asset, otherwise, from a time perspective, the gold price's correction wave has just begun, and the cumulative decline is bound to exceed $253.5! The short-term decline target is $3,610. In the short term, from the hourly chart, after the gold price dropped sharply with a large bearish candle in the early hours of Thursday, two major rebounds were both blocked at $3,672 and $3,673 respectively. The rebound amplitude was only slightly over 38.2% of the large bearish candle, still a bit away from the 50% level at $3,676.88. Therefore, the main resistance zone for the gold price in the future can be considered as $3,670 to $3,675. Another point to note is that after the gold price broke through the lowest point of the aforementioned large bearish candle at $3,646 in New York last night, it rebounded twice to that level but was blocked and fell back. Therefore, this level can be regarded as the main short-term resistance. That is to say, the gold price must stand firm above this level before it can be expected to challenge the resistance zone of $3,670 to $3,675. Using the TD line to measure the hourly chart trend, the big bearish candle on Thursday morning broke through the TD ascending track, and the measured decline target is exactly at the 225-degree angle of the Gann Square at $3,610. In other words, the gold price will remain in a range of $3,610 to $3,660 for a period of time. The above content is for reference only and does not constitute investment advice. MTF Special Analyst Zheng Guangfu


