
 en-US
en-US 

 Telegram
 WeChat


2025-09-19
"Gold Price Reversal Pattern Indicates Weakness" 18/9/2025 9:59 Completed The US Federal Reserve's FOMC cut interest rates by 25 basis points as expected after its meeting, lowering the federal funds rate to 4% to 4.25%. According to the latest forecast, FOMC members expect the median federal funds rate for this year to be 3.6%, lower than the 3.9% expected in June. This implies that rate cuts are likely at both the October and December meetings. Additionally, FOMC members raised their GDP growth forecast for this year from 1.4% to 1.6%, and increased their growth projections for the next two years by 0.1 percentage points to 1.8% and 1.9% respectively. However, the authorities maintained their forecast of 3.1% for core PCE inflation this year, but raised their inflation forecast for next year by 0.2 percentage points to 2.6%. Unemployment is expected to gradually decline, with the authorities maintaining their forecast of 4.5% for this year but lowering their unemployment rate projections for the next two years by 0.1 percentage points to 4.4% and 4.3% respectively. Interest rate cuts are all about managing risks. After the meeting, Federal Reserve Chair Powell said that the interest rate cut this time was mainly for risk management and there was no need for a rapid rate cut. The main consideration for the rate cut was the downside risk to the job market, and the revision of annual data meant that the labor market was no longer stable. Additionally, he believed that inflation was still high, but the impact of tariffs was short-lived. He also pointed out that the slowdown in consumer spending had led to a slowdown in economic growth, and the extent to which tariffs were passed on to consumers was smaller than expected. In response to the suggestion from the newly appointed governor, Michelle Bowman, to cut rates by 50 basis points, he said that the only way a single voting member could have an impact was by presenting a highly persuasive argument. Gold prices experienced significant fluctuations yesterday, with an overall trend of falling first and then rebounding. After rising to the day's high of $3,695.35 in the early Asian session, it repeatedly declined and reached a low of $3,660.55 in the mid-European session, which was the 270-degree vertical angle of the Gann Square. It then began to rebound and rose to $3,688.6 at the close of the London market. After that, it fluctuated around the $3,686 level. After the Federal Reserve announced the interest rate decision, gold prices rose to nearly $3,697, then fell below $3,650, and then rose sharply to a new high of $3,707.5. After that, it gradually declined, reaching a low of $3,646.26 before slowly recovering. In the early Asian session today, it approached $3,672, slightly rebounding to 38.2% of yesterday's maximum decline at $3,669.65, and then fell again. The gold price is currently in wave C. Technically, the gold price shows a strong bearish signal of a piercing pattern on the daily chart, suggesting a further decline in the near future. However, there is still considerable room for a rebound in the gold price. Moreover, the Federal Reserve is expected to cut interest rates twice more in the fourth quarter, providing a valid reason for the gold price to rise. Analyzing the hourly chart with the Elliott Wave Theory, the current gold price is in the c-wave, and its decline could be 1.382 or 1.618 times that of the a-wave, meaning the gold price could fall to $3,573.14. However, this would break through the starting point of the 1-wave, so based on this wave count, the gold price could fall to around but above $3,614.31. From the Gann Square perspective, the gold price has already broken through $3,660, and it is expected to fluctuate between $3,610 and $3,660 in the short term. The above content is for reference only and does not constitute investment advice. MTF Special Analyst Zheng Guangfu

2025-09-18
"Gold Price's 4th Wave Correction Points to $3,656" 17/9/2025 10:02 Completed Yesterday, the gold price broke through $3,700, reaching a new historical high of $3,703. However, on the hourly chart, it formed a double-line reversal pattern and closed at $3,686. Although it did not technically form a bearish engulfing pattern in terms of numbers, the double-line reversal was a relatively strong signal of a potential decline. Subsequently, the gold price dropped sharply to $3,679 at one point, but then gradually climbed back up. This morning, the gold price once reached as high as $3,695.35, but it showed a bearish pattern of a bearish engulfing pattern on the hourly chart and a clear descending flag formation. The decline then intensified, and it dropped to $3,676.87 before stabilizing around $3,680. Measured by the Fibonacci extension line from the new high last night, if the extension reaches 100%, the gold price will fall to $3,671.29, which is the minimum decline target for today. If the decline reaches 50% of the maximum increase from September 15 to 16, the gold price could reach $3,665. If the trend since September 11th is analyzed using the Elliott Wave Theory, yesterday's high point has met the requirement of the third wave being 1.618 times the first wave. Currently, it is in the fourth wave correction, with the target of the decline being close to but above the top of the first wave (or the starting point of the second wave) at $3,656.67. After that, the fifth wave of the impulse will be launched, and for the time being, the top of the third wave at $3,703 is set as the target. However, regardless of this, after the fifth wave ends, an ABC correction wave against the entire impulse will be initiated, and the start of a higher-level third wave will be marked by a break below the bottom of the fourth wave. In short, the current downside targets are $3,671, $3,665 and $3,656. If the Fibonacci extension is used to measure the hourly chart's trend, then $3,662, which is the 1.382 extension, and $3,656, which is the 1.618 extension (exactly the top of wave 1 or the starting point of wave 2), should also be noted. These are all important support levels for the downtrend. Looking at it from Gann's square, $3,660 is at the 270-degree vertical angle, which is a strong support or resistance level. The aforementioned $3,656 is close to this level, so it is inferred that $3,656 is the ultimate support level for this downtrend. Whether the gold price will reach a new high or enter a deeper correction wave in the future depends on the outcome of the Federal Reserve's interest rate decision tonight and its assessment of future inflation, employment and economic performance. The above content is for reference only and does not constitute investment advice. MTF Special Analyst Zheng Guangfu

2025-09-17
"Gold Price at $3,675 Marks the Bull-Bear Divide" 16/9/2025 9:59 Finalized Gold prices hit a new high. Spot gold prices plunged sharply at the beginning of the Asian session and then rebounded rapidly, which made me feel something was amiss. Spot gold prices dropped to a low of $3,626.65 in the early stage and then rose rapidly. Before the opening of the New York market, it consolidated in a narrowing triangle pattern. After the opening of the New York market, it broke through the downward trend line of the triangle in the hourly chart in a piercing pattern, reaching a high of $3,651. It then rose sharply for three consecutive hours, reaching a new historical high of $3,685. Foreign banks expect a 50 basis point interest rate cut. Gold prices hit a new high again before the Federal Reserve's interest rate meeting. The reason for this might be related to the expectations of major foreign banks regarding the extent of the rate cut this time. Societe Generale and Standard Chartered Bank expect the Federal Reserve to cut interest rates by 50 basis points at this meeting, but the market generally expects only a 25 basis point cut. Societe Generale believes that the Fed's moderately restrictive stance has exceeded its appropriate scope and has been overly restrictive, thus requiring a strong adjustment. Even though there are still concerns about more stubborn inflation, the risk balance is tilting towards the employment aspect of the Fed's dual mandate. If the Federal Reserve really cuts interest rates by 50 basis points, the US dollar exchange rate will surely fall sharply as it is beyond market expectations. The possibility of gold prices reaching a new high still depends on the current level of gold prices. If it is around $3,660, the possibility of a sharp increase of more than $20 is very high regardless of the extent of the rate cut. However, if it is above $3,680, the situation is different. If the rate is cut by 25 basis points, gold prices are likely to drop by $20 to $3,660 directly, or reach a new high first and then fall, causing a "double whammy". If gold prices are above $3,680 and the Federal Reserve cuts interest rates by 50 basis points, it may indicate that some market participants have already roughly known that the rate would be cut by 50 basis points. In this case, the possibility of gold prices breaking through $3,700 is relatively large. The short-term range is expected to be between $3,660 and $3,690. If the Federal Reserve only cuts interest rates by 25 basis points at this meeting but the latest economic forecast implies that further rate cuts are likely in the future, especially with upward revisions to the unemployment rate and downward revisions to the inflation rate and economic growth rate, the chances of rate cuts in October and December will increase. The performance of gold prices will be more volatile and will rise and fall with the quality of economic data, with employment data having a relatively greater impact. Gold prices hit a new high in the early Asian session this morning, with spot gold rising to the $3,689 level. However, a bearish engulfing candle was left on the 5-minute chart, and the price then dropped further to $3,677 before stabilizing slightly. Before closing below $3,676 on the hourly chart, there were no strong technical signals indicating a reversal. Measured by the Fibonacci extension from the September 11th movement, the accumulated gains since yesterday have reached 1.382 times the extension (3,685), which is a technical resistance level. In the short term, $3,675 is a key support level for gold. If it holds above this level, the trend will be strong; if it falls below $3,675, the trend will be weak. In a broader range, gold is expected to fluctuate between $3,660 and $3,690. The above content is for reference only and does not constitute investment advice. MTF Special Analyst Zheng Guangfu

2025-09-16
"Gold Prices Expected to Remain Range-bound" 15/9/2025 10:00 Completed This week is a super interest rate decision week as the Bank of Canada, the US Federal Reserve, the Bank of England and the Bank of Japan will successively announce their interest rate decisions. The market expects that the Bank of Canada and the Federal Reserve will both cut interest rates by 25 basis points, while the Bank of England and the Bank of Japan will keep their interest rates unchanged. The market's focus is naturally on the Federal Reserve's interest rate decision. However, a 25 basis point cut has already been reflected in the financial market, so this reduction should not cause significant fluctuations in the financial market. What is more influential should be how the Federal Reserve's decision-makers assess the economic performance, employment and inflation outlook of the United States in the next two years. Of course, if the Federal Reserve cuts interest rates by 50 basis points, that would be a completely different story! The sharp drop in gold prices has created profit opportunities. Gold prices continued to fall in the early Asian market today, hitting a low of $3,626.65, a drop of nearly $20 from the high. This is the sharpest and deepest decline in the early Asian market since the historical high of $2,647 on September 9. However, there was news this morning that Trump claimed he expected the Federal Reserve to cut interest rates significantly at this meeting. I believe he is putting pressure on the Federal Reserve and expressing the demands of a "boss". If so, why did the gold price fall sharply? I think it's the good friends of gold who closed their positions for profits before the Fed's interest rate decision, creating a larger fluctuation space for the gold price. On the other hand, as the saying goes, "while the mantis is in front, the yellow bird is behind." If you hold your position at a high level without closing it, there will be other speculators closing their positions. Unless all the gold enthusiasts are determined to push the gold price to a new historical high, otherwise, if $3,647 has become the ceiling, that is, the upward space of the gold price is limited, after a deeper correction, there will be a greater operating space. In this way, even if the Fed only cuts interest rates by 25 basis points, the gold price will still have a larger upward and profit space. The intraday rebound resistance is at $3,640. From the hourly chart, a sideways pattern is gradually taking shape. The gold price is trading between $3,614.3 and $3,657.5, which precisely falls within the Gann square support and resistance levels I pointed out, namely between $3,610 and $3,660. In other words, the gold price must break through these levels to have a chance to enter a new range. If it breaks upwards, the new range will be between $3,660 and $3,710; if it breaks downwards, the range will become between $3,610 and $3,560. I believe that before the Fed announces its interest rate decision, the gold price will remain within the range of $3,610 to $3,660. However, the possibility of a downward break is still greater, and any intraday rebound is likely to be capped at $3,640. The above content is for reference only and does not constitute investment advice. MTF Special Analyst Zheng Guangfu

2025-09-15
Silver Prices Reach New Highs and Remain in an Uptrend 12/9/2025 9:39 Completed Yesterday, the US released its August CPI. The overall year-on-year increase expanded from 2.7% to 2.9%, and the month-on-month increase also rose from 0.2% to 0.4%. Core CPI rose 3.1% year-on-year and 0.3% month-on-month, both in line with expectations and previous figures. However, the US dollar exchange rate fell across the board after the data release. The reason was not the CPI but the latest weekly initial jobless claims, which soared to 263,000, the highest level in four years. The market again bet that the Federal Reserve would cut interest rates as soon as next week. This is exactly what I mentioned yesterday: do not judge the rise and fall of gold prices solely based on inflation data. The gold-silver ratio is expected to continue to decline. Gold prices rose on the momentum, reaching a high of nearly $3,644, but still fell short of yesterday's Asian morning session high of $3,649.2 by $5. It then moved sideways. This morning in the early Asian session, it rose sharply to nearly $3,646, but overall it showed a slightly downward channel pattern. In contrast, silver hit a new high in the mid-New York session yesterday, with spot silver reaching $41.76, but then dropped sharply to a low of $41.46. This morning in the early Asian session, silver prices continued to decline to around $41.4, but then rose sharply again to $41.82, setting a new high. As gold prices fell, silver prices instead hit a new high, indicating that silver is catching up. At the same time, it also reflects that the current gold-silver ratio, which is still as high as 87.5 times, is being corrected. Assuming a 50% adjustment of the maximum increase from 2011 to 2020, the ratio will drop to 79.86 times. Support is available only when it returns to $40.9. The gold-silver ratio is expected to decline. The fastest way for this to happen is for the gold price to fall and the silver price to rise, but the positive correlation between gold and silver makes such an opportunity rare. The second scenario is that both gold and silver prices rise, but the silver price increases more than the gold price. The third scenario is that both gold and silver prices fall, but the silver price drops less than the gold price. Observing the hourly chart, the silver price has been in an upward channel since it broke through $40 on September 1st. It is also in perfect harmony with the overbought and oversold signals of the 9RSI indicator. That is, when it reaches above 80, it starts to correct, and when it falls below 20, it rebounds. According to this rhythm, the silver price is expected to rise again after falling to around $40.9. Currently, the resistance level is approximately $42.15. Gold prices failed to reach new highs for two consecutive days, but still closed above $3,600. The lowest point yesterday was only $3,614. I still believe that gold prices will continue to fluctuate between $3,610 and $3,660 in the short term. The Federal Reserve's FOMC will hold its interest rate meeting next Wednesday and Thursday. There are not many important data releases in the US next week. Only the retail sales data for August, which will be released on Wednesday, may cause a brief market disturbance. I believe that the market will not show a new trend until the Fed announces its interest rate decision. However, as we are approaching the fourth quarter of this year, the current trend may reverse before the end of the year. The above content is for reference only and does not constitute investment advice. MTF Special Analyst Zheng Guangfu

2025-09-12
"Gold Price Forms Narrowing Triangle in Short Term" 11/9/2025 9:08 Completed The upward trend of gold prices reaching new highs came to an end yesterday. Although the spot gold price dropped to $3,620.9 in the early Asian session and then continued to rise, reaching a high of $3,657.5 in the London midday session before fluctuating and falling, it did not resume its upward trend as it had in the past period or even reach a new high in New York. Instead, it plunged sharply after the release of the US August PPI data showing a slower year-on-year increase. The data indicated that the overall US PPI rose by 2.6% year-on-year in August, down from 3.1% in July, while the core PPI rose by 2.8% year-on-year, down from 3.4% in July. Both declined by 0.1% month-on-month. The market had expected both the overall and core PPI to rise month-on-month and for the year-on-year increase to expand further. The actual results were completely contrary to market expectations. Gold prices are not influenced by inflation. Logically, forward-looking indicators suggesting a reduction in inflationary pressure should give the Federal Reserve more room to cut interest rates, which would be beneficial for gold prices. However, gold is also regarded as an inflation hedge. If inflationary pressure decreases, the inflation-hedging role of gold will also diminish, leading to a decline in gold prices. Conversely, if inflation rises, it indicates that the Fed has less room to cut rates and may even face pressure to raise rates, which would also put downward pressure on gold prices. Therefore, investors should not judge the rise and fall of gold prices solely based on inflation. Especially given that global interest rates have risen significantly compared to pre-pandemic levels and most economies are in a positive real interest rate environment, gold, which cannot appreciate on its own, naturally loses its luster. It is expected that the short-term range will fluctuate between 3610 and 3660. From the hourly chart, the spot gold price rose to $3,674 and has since developed into a narrowing triangle, oscillating around the median of the range at $3,647.5. If the gold price opens above the downtrend line and closes higher within any one-hour period in the future, it can be confirmed that an upward breakout has occurred, with a measured target of $3,657. Conversely, if it breaks below the uptrend line, the lowest measured target is $3,610. Measured by the Fibonacci extension line from the movement since September 10th, if the extent reaches 100%, the gold price could reach close to $3,672. From the Gann Square perspective, the gold price is expected to fluctuate within the range of $3,660 to $3,610 in the short term. The above content is for reference only and does not constitute investment advice. MTF Special Analyst Zheng Guangfu

2025-09-11
"Gold Price Shows Strong Hourly Reversal Signal" 10/9/2025 9:26 Completed It was thought that the $3,659 reached by gold in the Asian session yesterday would be the ultimate historical high. However, gold shot up to $3,668 in the early New York session and then climbed to $3,674. But it left a large bearish engulfing candle on the hourly chart and dropped to $3,627 before the New York midday session. The daily range expanded to nearly $47. Gold formed a shooting star pattern on the daily chart, which was the first strong bearish signal since August 22. Big players use data to hide sell orders. The general investors may attribute the sharp rise of gold prices in New York to the fact that the US Department of Labor revised the total non-farm employment population for the 12 months ending in March this year downward by 911,000. Among them, the non-farm employment in private enterprises was revised down by 880,000, and the employment in trade, transportation and public utilities was revised down by 226,000, including a decrease of 110,300 in wholesale trade and 126,200 in retail trade; professional and business services positions were revised down by 158,000. The market is once again speculating about interest rate cuts, and at most, it's also hyping up the increased risk of the US economy falling into recession. However, judging from the performance of gold prices yesterday, the trend has clearly weakened. But have investors noticed that gold prices could first hit a new high for the day and then a new low within 75 minutes, and the fluctuation within the first 10 minutes was nearly 32 dollars? My understanding is that major players are trying to use the downward revision of US employment data to hide their selling pressure. Because ordinary investors would only think that the decline in gold prices is caused by the downward revision of the data. However, no matter how large the downward revision is, it's just speculation about the interest rate cut next week. But didn't Powell hint at this as early as August 22nd? $3,660 remains a strong resistance. As for the performance of gold prices, although they reached a high of $3,674 yesterday, they failed to hold above $3,660, which is the 270-degree vertical angle of the Gann Square, indicating that this level remains a significant resistance point. From the hourly chart, gold prices formed a bearish engulfing pattern after hitting a new historical high yesterday, and this morning they dropped to $3,621, breaking through both the 20 and 50 SMA. Looking at the Gann Square, the short-term support levels are $3,610, $3,560, $3,510, $3,460... Among these, $3,560 and $3,460 are relatively stronger. Recently, gold prices have been rising to new highs every day. Therefore, if they fail to reach a new high, especially if the Federal Reserve cuts interest rates next week and gold prices still cannot break through the top, it indicates that gold prices are likely to undergo further adjustments. The above content is for reference only and does not constitute investment advice. MTF Special Analyst Zheng Guangfu

2025-09-10
"Gold Price at $3,660 Acts as a Strong Short-Term Resistance" 9/9/2025 9:41 Completed Gold prices on Monday did not weaken as expected. They only slightly declined in the early Asian market but continued to rise after the European market opened. Spot gold prices reached a new high of $3,646 near the midday in New York. However, from the hourly chart, it can be seen that after reaching the new high, gold prices closed lower with a bearish candle, which was the first bearish candle since the European market opened. Subsequently, it further retraced to $3,633. Yesterday, it was pointed out that based on the Gann Square and a $50 price difference, the short-term resistance levels were $3,610 and $3,660, with $3,660 being the strongest resistance. Yesterday, the spot gold price was only $14 away from this level, so $3,660 remains the key short-term resistance for gold prices at present. Political unrest in France benefits gold prices. Gold prices remain supported by multiple objective factors, such as the lack of a ceasefire timetable between Russia and Ukraine, many countries still not reaching tariff agreements with the United States, the risk of recession in the US, and the possibility of the Federal Reserve cutting interest rates as early as next week. Currently, the political situation in France is drawing attention and has also become an excuse for the continuous rise in gold prices. French Prime Minister Philippe earlier requested a vote of confidence from the National Assembly on his plan to significantly cut the budget to reduce the government's financial pressure, but the plan was rejected with 364 votes against and 194 in favor. Philippe is expected to resign today. Another poll shows that 49% of respondents want President Macron to step down, and 15% hope for the dissolution of the government. ECB President Lagarde expressed concern over the political situation in France. Before that, she also warned that the collapse of any government in the eurozone is a worrying risk. The ECB will hold an interest rate meeting this Thursday. Currently, the market expects the interest rate to remain unchanged. If there is an unexpected rate cut, apart from putting pressure on the euro, it is believed that gold prices will rise further under the background that the Fed is likely to cut interest rates next week. Strong support from the 20-hour SMA Although the gold price has been on the rise, there have been adjustments during this period. As seen from the hourly chart, whenever the 9RSI reaches 80 or above, the gold price experiences a pullback, and the 20SMA currently appears to be a reliable support line. This morning, the gold price reached a new high of $3,646.68, slightly higher than yesterday's high of $3,646.43. It then pulled back to the $3,642 level. There is a possibility of a double top formation in the short term, but for now, the first important support level is the 20SMA on the hourly chart at $3,626. The daily chart of the gold price has not yet sent out a signal of a downturn. It remains to be seen whether it can break through the resistance at $3,660. However, given that the 9RSI on the quarterly chart of the gold price has long exceeded 90, the time for a major decline is getting closer. Investors should not be greedy for gains and ignore losses, and must not overlook any strong signals of a downturn in any time frame. The above content is for reference only and does not constitute investment advice. MTF Special Analyst Zheng Guangfu

2025-09-09
"Gold Price's Intraday Trend Fluctuates Downward" 8/9/2025 9:43 completed The U.S. August employment data fell short of expectations, reinforcing market expectations that the Federal Reserve will cut interest rates next week. The U.S. Department of Labor announced that non-farm payrolls rose by only 22,000 in August, far below the expected 75,000 and the upward-revised 79,000 in July. The unemployment rate also rose from 4.2% to 4.3%. The data reflects the continuous cooling of the U.S. labor market. FedWatch shows that investors expect an 88.1% probability of a 25 basis point interest rate cut next week. The unsatisfactory employment data led to a sharp decline in the US dollar exchange rate across the board, and the gold price also rose sharply. The spot gold price rose to a high of $3,600, setting a new historical record. However, the holdings of the SPDR Gold ETF remained unchanged last Friday. However, data from the People's Bank of China shows that China's gold reserves reached approximately 2,302.28 tons at the end of August, an increase of about 1.87 tons compared to July. This marks the tenth consecutive month of increased gold holdings. The CPI in August will affect the extent of interest rate cuts In terms of geopolitics, Russian President Vladimir Putin ignored calls for a ceasefire against the attacks on Ukraine and instead warned that countries sending troops to Ukraine would become "legitimate targets" of Russia. At present, factors such as tight global trade, uncertain tariffs, geopolitical conflicts and inflation are all exerting pressure on the US dollar, thereby enhancing the demand for gold. The US August CPI data will be released this Thursday and is an important inflation figure before the interest rate decision. Currently, the market expects the year-on-year increase in the CPI to expand from 2.7% to 2.9%. Under the condition of balancing employment and the inflation rate, it is more likely that the interest rate will be reduced by 25 basis points even if it is cut. Only when the CPI inflation rate drops sharply, for instance, below 2.4% or less, is it possible for the Federal Reserve to cut interest rates by half a percentage point. 3548 is an important support point for the day Last Friday, it was pointed out that the gold price reaching a new high last Friday was regarded as a perfect short-term top. Therefore, this week, there is a tendency to repeatedly adjust and consolidate to make arrangements for the Federal Reserve's interest rate decision. Currently, on the weekly chart, measured by the TD line, the upward target is approximately $3,785. If calculated based on the Gann Square and a price gap of $50, the short-term resistance levels are $3,610 and $3,660, with the resistance at $3,660 being the greatest. If the resistance at $3,660 is broken through, the next resistance level will be $3,710. Since the resistance at $3,710 is relatively small, $3,660 will then become the target for both bulls and bears to compete for. And if it breaks through $3,710, The next resistance is $3,810. In other words, if the gold price breaks through and stabilizes above $3,660, it will tend to fluctuate between $3,660 and $3,810 for a period of time. On the contrary, if $3,600 is confirmed as a medium and short-term resistance, then the important support levels for gold prices in the future will be $3,550, $3,450, $3,350, $3,250, $3,100 and $2,900 respectively. Gold prices opened slightly higher this morning and then moved sideways. They later broke through the intraday high to $3,597.3 and then dropped to $3,585, creating a pattern of a sharp decline on the hourly chart. The low before the upward break last Friday was $3,548. It is estimated that there will be a support at this level. The intraday range is expected to fluctuate between $3,548 and $3,600. The above content is for reference only and does not constitute investment advice. Zheng Guangfu, a special analyst of MTF

2025-09-08
"Gold Price Expected to Range Sideways Intraday" 5/9/2025 9:41 Finalized Gold prices continued their decline from the New York session in the early Asian session yesterday. They bottomed out at $3,511 in the Tokyo midday session before rebounding and gradually recouping losses. In the early New York session, they rose to near $3,559 and then traded sideways between $3,540 and $3,555. Regarding data, the August ADP private sector employment report, which was closely watched by the market, showed that only 54,000 new jobs were added, falling short of the expected 73,000. Nela Richardson, chief economist at ADP, said that while job growth was strong at the beginning of the year, this momentum was disrupted by uncertainties, leading to a slowdown in hiring, including labor shortages, consumer concerns, and the impact of artificial intelligence. Speculators are focusing their efforts on the non-farm payroll. However, the gold price did not surge significantly despite the data being worse than expected and the previous value. Instead, it declined somewhat. Subsequently, the multiple economic data released by the United States were mixed. Although the gold price approached $3,359 at the beginning of the US stock market opening, it did not align with the release time of the US economic data, and this level was the highest trading price throughout the New York trading session. After that, the gold price fluctuated within approximately $15. The spot gold price eventually closed at around $3,552 with a long-tailed hammerhead rebound. Gold prices did not react much to the ADP employment data. It is estimated that market forces are focused on the August non-farm payroll data to be released tonight. In terms of other data, SPDR Gold ETF reduced its holdings by another 2.29 tons yesterday, bringing the total holdings down to 981.97 tons. In terms of investor sentiment, the long-short ratio remained at 42% and 58%. $3,556 is a short-term resistance level. Gold prices rebounded after hitting a low of $3,540 in the Asian session this morning, but failed to break through the $3,556 level several times and retreated. From the hourly chart, it is clear that the rebound has encountered resistance after recovering 61.8% of yesterday's biggest decline. The resistance at the high of the large bearish candle that broke through the horizontal range in the early Asian session yesterday at $3,563 is even stronger. It is estimated that before the release of the US August non-farm payroll data, gold prices will fluctuate within the range of $3,560 to $3,535 for most of the day. Judging from the short-term cyclical trend, if gold prices reach a new high today, it can be regarded as the perfect time for a peak. Otherwise, the peak will be confirmed on Wednesday. The above content is for reference only and does not constitute investment advice. MTF Special Analyst Zheng Guangfu

2025-09-05
"Gold Price Seriously Overbought, Crash Imminent" 4/9/2025 9:53 Finalized Gold prices have hit new highs for the third consecutive day. The spot price of gold rose to $3,578.5 in the New York midday session yesterday. This rally, which began on August 22, shares similarities with the one that started on April 9 from $2,970. That rally lasted for nine trading days, reaching a peak of $3,500, with a total increase of $530, averaging about $59 per day. This current rally, which started from a low of $3,321 on August 22, is driven by speculation that the Federal Reserve may cut interest rates as early as this month. So far, gold prices have risen by nearly $240 over nine trading days, averaging an increase of about $28 per day, which is less than the average daily fluctuation of around $30 in the past. Gold hit a temporary low of $3,552 in the early Asian session today, down $26.5 from the high of $3,578.5 in the New York session last night. The trend is similar to that from August 27 to 29. However, on August 27, gold peaked at $3,394 at 6 a.m. and bottomed out at $3,374 at 12 p.m., falling by $20. On August 28, gold also peaked at 6 a.m., touching $3,399 before falling, but the lowest point was only $3,384.7, and it rebounded after a drop of more than $15. On August 29, gold hit a high of $3,423 at 3 a.m. and began to fall, continuing until 7 p.m., when it bottomed out at $3,404.5 before rebounding, with a maximum drop of $18.5. SPDR reduced its holdings, with short positions in gold accounting for 58%. The gold price has experienced the largest adjustment this round. It can be confirmed that investors have taken profits and exited the market in advance before the release of the US ADP employment data. If the data is not too good and the gold price does not reach a new high today, it is highly likely that the gold price has peaked. Data shows that the proportion of short positions held by investors in gold has reached 58.4%, which is significantly different from the previous situation where long and short positions were evenly split. The SPDR Gold ETF also reduced its holdings by 6.3 tons on September 3rd. Gold prices tend to retest the $3,500 level. I personally believe that the gold price has peaked and is likely to decline in the short term. From the four-hour chart, if we adjust for the 50% retracement of the largest increase since August 22nd, the gold price will reach $3,450, which is also my initial short-term target for the gold price adjustment. In terms of overbought conditions, the 9RSI on the daily chart is still as high as 82, on the monthly chart it is 91.5, and on the quarterly chart, the 9RSI has also reached 90, which is the most severe in history. Therefore, it is certain that the gold price is about to collapse! Considering the increase from the lowest point of $1,616.18 in November 2022 to the highest point of $3,578.5 yesterday, I expect the gold price to adjust by 50% of the above increase to $2,597 as the medium and long-term decline target. In the short term, $3,564 is the first resistance level, and the first support level is $3,525. However, I believe that the gold price will test $3,500 in the short term and may even fall below that level. It is possible that $3,450 will be reached within the next two days. The above content is for reference only and does not constitute investment advice. MTF Special Analyst Zheng Guangfu

2025-09-04
"Gold Price at $3,500 Becomes a Strong Support" 3/9/2025 9:57 Completed Yesterday, the spot gold price rose to a high of $3,508.5 in the Asian market before falling. In the early London market, it dropped to around $3,470. However, the lowest point on the hourly chart was only $3,477, which is the key support level we mentioned yesterday. In other words, although the gold price fell from its peak, it did not meet the hourly chart's signal of a downward trend. Subsequently, the gold price fluctuated below $3,494. It was only after the release of the August ISM Manufacturing PMI in the United States, which was worse than expected, that the gold price climbed again. Despite this, the US ISM manufacturing PMI for August was 48.7, lower than the expected 49 but still higher than July's 48. The new orders index rose from 47.1 in July to 51.4 in August, with the employment index also slightly increasing from 43.4 to 43.8. Although the data indicates that the US manufacturing sector is still contracting, there has been some improvement. However, the US IBD/TIPP Economic Optimism Index dropped from 50.9 in August to 48.7 in September, reflecting that American consumers are pessimistic about the economic outlook, personal finances, and federal economic policies for the next six months. Political unrest has driven up the price of gold. Spot gold prices rose sharply after the release of the above data. Besides the US factors, the sharp fall in UK government bond prices and the pound's sharp depreciation due to the country's fiscal problems also served as reasons for funds to flow into the gold market for safekeeping. Additionally, the French far-right National Rally (RN) party stated that it is preparing for an early general election and expects the opposition to overthrow the minority government in the September 8 vote, which led to a sharp rise in French 30-year bond yields to their highest level since June 2009. The more unstable the political situation is, the more favorable it is for the gold price. The spot gold price rose to nearly $3,540 in the late afternoon of New York yesterday, exceeding my earlier calculated target of about $3,536 based on the breakthrough of the TD descending track. From the daily chart, assuming that the low of $3,268.15 on July 30 was the starting point of wave 1, wave 2 began on August 8 at $3,408.83 and ended on August 20 at $3,311.46, entering wave 3. Assuming that the amplitude of wave 3 is 1.618 times that of wave 1, the gold price will end wave 3 at $3,539.08 and then enter wave 4, with the maximum adjustment level being close to but above $3,408.83. The key short-term level is $3,528.5. Spot gold prices rebounded after hitting a low of $3,526.5 in the early Asian session today and reached a new high of $3,547. As the gold price has broken through $3,500, this level has become a new strong support level. Since the 3-wave rise in gold prices has reached 1.618 times the 1-wave rise, I remain highly vigilant about whether the gold price will experience a significant decline. Additionally, investors should not overlook that the 9RSI of spot gold prices has reached 84 on the daily chart and exceeded 91 on the monthly chart. Severe overbuying will eventually lead to a sharp drop in gold prices. In the short term, if spot gold prices close below $3,528.5 on the hourly chart, it will be regarded as a signal of a downturn, and $3,500 will be the first important support level. The above content is for reference only and does not constitute investment advice. MTF Special Analyst Zheng Guangfu

2025-09-03
"Gold Prices Soar to New Highs Then Plunge; Further Adjustments Expected" 2/9/2025 10:15 Completed Yesterday, the gold price movement was largely in line with expectations. The spot gold price rose sharply to nearly $3,490 at the beginning of the European market opening, then dropped rapidly. After that, it fluctuated and fell to around $3,466 before gradually recovering lost ground and rebounding to a high of $3,481. Due to the US market being closed yesterday, trading was slightly weaker, and the gold price remained in a sideways pattern throughout the European market. In the early Asian market today, the spot gold price repeated the trend seen in the Asian market yesterday, rising continuously from around $3,477 and reaching a new high of $3,508.5. Gold prices have been climbing since Federal Reserve Chair Powell hinted at the possibility of a rate cut in the near future at the Jackson Hole central bank symposium on August 22. From the closing price of $3,338.8 on August 21, it has risen by more than $165 in eight trading days. As pointed out yesterday, gold prices have clearly shown multiple technical breakthrough signals, and the current upward target remains at $3,536. Gold prices have broken through the resistance of the large flat-topped ascending triangle on the daily chart, and the highest closing price of $3,432 of this pattern is expected to become a strong support in the medium term. $3,450 is the first adjustment support. After hitting a new high, the gold price quickly dropped and formed a bearish engulfing pattern on the 5-minute chart. Currently, it is important to note that if the gold price fails to reach a new high before the European market opens, it is expected to fall further after the European market starts, or it may rebound slightly before continuing to decline. Technically, the gold price must break through this morning's high to have a chance of resuming its upward trend. However, a strong bearish signal has emerged technically, and $3,500 is likely to become a level where bulls and bears will battle. From the four-hour chart, the gold price has reached the 1.382 Fibonacci extension level. $3,437 is precisely the 38.2% retracement of the largest increase since August 22nd. Therefore, it is expected that the short-term peak of the gold price has been formed. The price is likely to fall further within the day, with $3,450 as the first key support level and $3,437 as the next important support level. The above content is for reference only and does not constitute investment advice. MTF Special Analyst Zheng Guangfu

2025-09-02
"Gold Price Rises Sharply; Beware of Short-Term Peak" 1/9/2025 10:16 Completed Last Wednesday, I expected that gold would encounter resistance only when it rose to $3,450. On Friday, I pointed out the significance of $3,400 and that friends would defend this level. As a result, gold only dropped to the $3,404 level in the early Asian session on Friday, and rose as high as $3,454. The closing price was only back at $3,448. There is no doubt that gold broke the two-day reversal curse after rising above $3,400 on Friday and showed a clear technical breakthrough. Based on the highest closing price on the daily chart, gold prices broke through the resistance of the flat-topped ascending triangle formed since early April this year at $3,432.6 on Friday. Moreover, gold prices have long broken through the TD descending track on the daily chart. The measured target remains the previously mentioned $3,536. However, in terms of short-term trends, using the Fibonacci extension line to measure the movement since July 30, the highest price of gold on Friday has exceeded the 100% extension increase of $3,452.14. Therefore, it can be judged that gold prices will undergo a short-term adjustment. US employment data fails to dampen expectations of interest rate cuts Due to the significant technical breakthrough in gold prices last Friday and the Federal Reserve's inclination to cut interest rates again this month, gold prices are unlikely to experience a sharp decline. Moreover, the US markets are closed today for Labor Day, resulting in even lower volatility. It is worth noting that the US will release the August ADP private employment report this week, with market expectations of an increase of 71,000 jobs. The US Department of Labor will also release the August non-farm payroll report this Friday, with market expectations of an increase of 74,000 non-farm jobs and a slight rise of 0.1 percentage point in the unemployment rate to 4.3%. Such data would undoubtedly be favorable for gold prices. However, some market voices have pointed out that the focus of the latest non-farm payroll report lies in the revision values, and the data may cause market fluctuations, but it is believed that it will not change the probability of the Federal Reserve cutting interest rates this month. As for the gold market, the SPDR Gold ETF holdings increased by 9.74 tons to 977.68 tons last Friday, meaning that it has been continuously increasing for five consecutive trading days last week. In total, it increased by 20.91 tons for the entire week. Due to the US market being closed today, the gold price may experience significant fluctuations. This morning, the gold price hit a low of $3,437 in the early Tokyo market and then continued to rise, breaking through the high point of last Friday and reaching a high of $3,471. It then slightly retreated to $3,455. $3,450 is the first key support level. It seems that Asian investors are aiming to take the lead in the market while the US is closed and Europe has not yet opened. They may even directly challenge the $3,500 mark, leaving European friends with no good entry point. Therefore, it is important to note that if the gold price remains at its intraday high in the early part of the Tokyo midday session, it is very likely to fall sharply after Europe opens, especially since today is a potential short-term cycle top for the gold price. The higher the price closes today, the greater the probability of an adjustment wave starting tomorrow. Conversely, if the gold price has already given back most of its gains from the Asian session before Europe opens, it is expected to fluctuate within the range of $3,437 to $3,471 for the day. $3,450 is the first important support level, with $3,437 being the second. $3,400 is believed to be a strong support level before the Fed's interest rate announcement. The above content is for reference only and does not constitute investment advice. MTF Special Analyst Zheng Guangfu

2025-08-29
"Gold Price May Form a Large Double Top Pattern" 28/8/2025 10:03 Completed Gold prices maintained a strong trend yesterday, finding support at the $3,373 level, which was in line with the second support level I predicted yesterday. From the hourly chart, it can be seen that spot gold prices broke through the $3,385 level in the Asian session and attempted to break through this level again in the early European session, but failed. However, the climax was yet to come. Gold prices surged in the midday New York session, reaching a high of nearly $3,399. The fate of Powell has been decided. Tonight, the United States will release the revised second-quarter GDP figure, with an expected annualized quarterly growth rate of 3%, the same as the initial estimate. Additionally, the US will also release the revised second-quarter core PCE price index, with an expected quarterly increase of 2.5%, a slower pace than the 3.5% increase in the first quarter. Although both are lagging indicators, they can definitely serve as an excuse for market speculation. On the other hand, US Treasury Secretary Mnuchin stated that the 11 candidates for the Federal Reserve chair position are all strong contenders, and they will be interviewed after Labor Day and the final list will be submitted to Trump. This is equivalent to telling Powell that we will not renew your contract when your term expires in May next year! It can be said that the fate of Powell has already been decided, and the market can use this as a reason to push up gold prices at any time. Gold prices rose further to $3,399 in the early Asian session today before retreating. From the hourly chart, the morning high has penetrated the dense zone on August 8th, but failed to break through the $3,400 mark. Be cautious of a potential large double top formation. If it falls below the short-term TD ascending track at $3,377, the measured decline target is at the $3,355 level, which coincides with the 50% retracement of the largest increase since August 20th and can be regarded as an important support within the day. However, the adjustment is too small. If gold prices continue to fall, it is not ruled out that it will test the neckline of the large double top, that is, the low of August 20th at $3,311. $3,400 is like a curse. A spellbinding phenomenon remains unbroken to this day. Since April 21st, whenever the gold price closed above $3,400 on a daily chart, it would reverse the next day and fall below $3,400 to close, followed by a deeper correction. This time, if the gold price crosses the $3,400 mark without breaking it, it may signal the start of another significant decline and should be watched closely. From another perspective, if the gold price closes above $3,400 for two consecutive days, this "curse" will be broken, and it might be a precursor to a new high in gold prices! The above content is for reference only and does not constitute investment advice. MTF Special Analyst Zheng Guangfu

2025-08-28
Gold prices are expected to rise to $3,450 before encountering resistance. 27/8/2025 9:21 Finalized. Gold prices performed stronger than expected yesterday, but it was not a surprise. The key lies in how investors position themselves based on the anticipation of the Fed's interest rate cut. Currently, the market is more concerned about the follow-up developments of Trump's dismissal of Fed governor Cook. Whether Trump has the right to do so will be determined by the court. It is speculated that if Trump wins the case, it would mean the Fed losing its independence, and the Fed would significantly cut interest rates next year to meet Trump's personal desires. I believe Trump will lose the case, but it is certain that Powell will not be reappointed when his term expires in May next year. At that time, Trump will appoint someone who is on his side to take over. If the Fed really cuts the federal funds rate to a negative 1% level, it would indicate that the Trump administration has shifted to a weak-dollar strategy, and the possibility of gold prices reaching new highs would increase significantly. US durable goods orders improved in July. Gold prices were also clearly affected by the above-mentioned news. Even though the US released July durable goods orders data, which showed a 2.8% month-on-month decline, a significant improvement from the 9.3% drop in June, and a 1.1% increase when excluding defense and aircraft orders, far exceeding the expected 0.3% increase and better than the 0.6% decline in June, it did not lead to a significant pullback in gold prices. From the hourly chart, spot gold prices rose sharply to around $3,387 in the early Asian session yesterday with a large bullish candle, and then consolidated in a narrow range at the high level. The lowest point was only $3,351, close to the 50% retracement level of $3,350 mentioned yesterday. However, for most of the time, it closed above $3,370 on the hourly chart and rose to around $3,394 in the late New York session. The price of 3353 material is expected to resume its upward trend. From the four-hour chart, assuming that the upward trend starting from the low of $3,311.62 on August 20th has the same magnitude as the maximum increase from July 31st to August 8th, the gold price will rise to $3,452.32. If the upward break of the downtrend channel in the early Asian market yesterday is taken into account, the measured upward target is approximately $3,448, which is less than $5 away from the Fibonacci expansion target of $3,452.32. Taking the median of the two, the gold price is expected to rise to around $3,450 before a significant correction. However, the gold price is likely to have reached a short-term peak yesterday, with the previous resistance at $3,380 becoming the first support level. Further declines will have important support levels at $3,373 and $3,353, and it is expected that the gold price will stabilize and resume its upward trend when it falls to around $3,353. The above content is for reference only and does not constitute investment advice. MTF Special Analyst Zheng Guangfu

2025-08-28
Gold prices are expected to rise to $3,450 before encountering resistance. 27/8/2025 9:21 Finalized. Gold prices performed stronger than expected yesterday, but it was not a surprise. The key lies in how investors position themselves based on the anticipation of the Fed's interest rate cut. Currently, the market is more concerned about the follow-up developments of Trump's dismissal of Fed governor Cook. Whether Trump has the right to do so will be determined by the court. It is speculated that if Trump wins the case, it would mean the Fed losing its independence, and the Fed would significantly cut interest rates next year to meet Trump's personal desires. I believe Trump will lose the case, but it is certain that Powell will not be reappointed when his term expires in May next year. At that time, Trump will appoint someone who is on his side to take over. If the Fed really cuts the federal funds rate to a negative 1% level, it would indicate that the Trump administration has shifted to a weak-dollar strategy, and the possibility of gold prices reaching new highs would increase significantly. US durable goods orders improved in July. Gold prices were also clearly affected by the above-mentioned news. Even though the US released July durable goods orders data, which showed a 2.8% month-on-month decline, a significant improvement from the 9.3% drop in June, and a 1.1% increase when excluding defense and aircraft orders, far exceeding the expected 0.3% increase and better than the 0.6% decline in June, it did not lead to a significant pullback in gold prices. From the hourly chart, spot gold prices rose sharply to around $3,387 in the early Asian session yesterday with a large bullish candle, and then consolidated in a narrow range at the high level. The lowest point was only $3,351, close to the 50% retracement level of $3,350 mentioned yesterday. However, for most of the time, it closed above $3,370 on the hourly chart and rose to around $3,394 in the late New York session. The price of 3353 material is expected to resume its upward trend. From the four-hour chart, assuming that the upward trend starting from the low of $3,311.62 on August 20th has the same magnitude as the maximum increase from July 31st to August 8th, the gold price will rise to $3,452.32. If the upward break of the downtrend channel in the early Asian market yesterday is taken into account, the measured upward target is approximately $3,448, which is less than $5 away from the Fibonacci expansion target of $3,452.32. Taking the median of the two, the gold price is expected to rise to around $3,450 before a significant correction. However, the gold price is likely to have reached a short-term peak yesterday, with the previous resistance at $3,380 becoming the first support level. Further declines will have important support levels at $3,373 and $3,353, and it is expected that the gold price will stabilize and resume its upward trend when it falls to around $3,353. The above content is for reference only and does not constitute investment advice. MTF Special Analyst Zheng Guangfu
2025-08-28
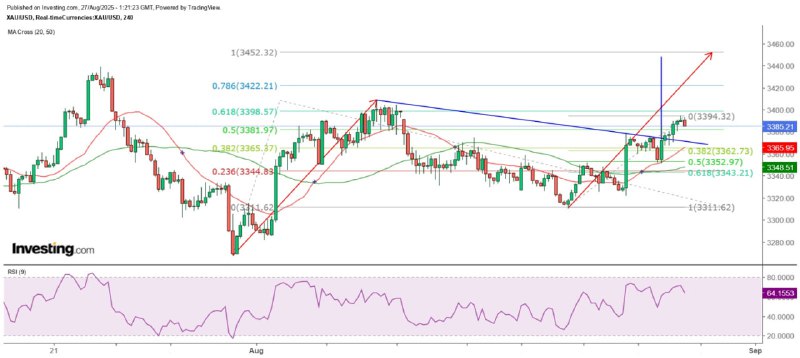
Gold prices are expected to rise to $3,450 before encountering resistance. 27/8/2025 9:21 Finalized. Gold prices performed stronger than expected yesterday, but it was not a surprise. The key lies in how investors position themselves based on the anticipation of the Fed's interest rate cut. Currently, the market is more concerned about the follow-up developments of Trump's dismissal of Fed governor Cook. Whether Trump has the right to do so will be determined by the court. It is speculated that if Trump wins the case, it would mean the Fed losing its independence, and the Fed would significantly cut interest rates next year to meet Trump's personal desires. I believe Trump will lose the case, but it is certain that Powell will not be reappointed when his term expires in May next year. At that time, Trump will appoint someone who is on his side to take over. If the Fed really cuts the federal funds rate to a negative 1% level, it would indicate that the Trump administration has shifted to a weak-dollar strategy, and the possibility of gold prices reaching new highs would increase significantly. US durable goods orders improved in July. Gold prices were also clearly affected by the above-mentioned news. Even though the US released July durable goods orders data, which showed a 2.8% month-on-month decline, a significant improvement from the 9.3% drop in June, and a 1.1% increase when excluding defense and aircraft orders, far exceeding the expected 0.3% increase and better than the 0.6% decline in June, it did not lead to a significant pullback in gold prices. From the hourly chart, spot gold prices rose sharply to around $3,387 in the early Asian session yesterday with a large bullish candle, and then consolidated in a narrow range at the high level. The lowest point was only $3,351, close to the 50% retracement level of $3,350 mentioned yesterday. However, for most of the time, it closed above $3,370 on the hourly chart and rose to around $3,394 in the late New York session. The price of 3353 material is expected to resume its upward trend. From the four-hour chart, assuming that the upward trend starting from the low of $3,311.62 on August 20th has the same magnitude as the maximum increase from July 31st to August 8th, the gold price will rise to $3,452.32. If the upward break of the downtrend channel in the early Asian market yesterday is taken into account, the measured upward target is approximately $3,448, which is less than $5 away from the Fibonacci expansion target of $3,452.32. Taking the median of the two, the gold price is expected to rise to around $3,450 before a significant correction. However, the gold price is likely to have reached a short-term peak yesterday, with the previous resistance at $3,380 becoming the first support level. Further declines will have important support levels at $3,373 and $3,353, and it is expected that the gold price will stabilize and resume its upward trend when it falls to around $3,353. The above content is for reference only and does not constitute investment advice. MTF Special Analyst Zheng Guangfu

2025-08-27
"Gold prices are expected to remain in a range-bound pattern in the short term." 26/8/2025 9:32 Completed. Yesterday, the gold price fluctuation narrowed significantly, with the high-low range being just over 16 dollars. As seen from the hourly chart, the gold price bottomed out at 3326 dollars in the early New York session and then rebounded. Before the New York midday, it reached a high of 3376 dollars. However, it failed to break through the high of last Friday and instead turned downward. In the early Asian session today, it dropped to 3354 dollars, slightly testing the 38.2% retracement level of the biggest increase since last Friday. Although the gold price later rose sharply to 3386 dollars, it soon returned below 3380 dollars. Employment data influence monetary policy. Even though the Federal Reserve is highly likely to cut interest rates in September, there are still more than three weeks until the interest rate meeting. During this period, the economic data released by the United States still leaves room for uncertainty at the end of the meeting next month. In particular, the August non-farm payroll report to be released on September 5 and the August CPI to be released on September 11 are both important considerations for the Fed's monetary policy decisions. However, the non-farm payroll report is more closely watched. If the number of new jobs remains below 100,000, it is almost certain that the Fed will cut interest rates in September. Currently, interest rate futures suggest that the Federal Reserve is more likely to keep interest rates unchanged in October and cut them by 25 basis points in December. Additionally, the Federal Reserve will release its latest economic projections after the September interest rate meeting, including its views on the economy, inflation, and employment. The economic projections released by the Federal Reserve in June indicated that the median federal funds rate is expected to be 3.6% and 3.4% in the next two years, higher than the 3.4% and 3.1% projected in March, with a long-term target of 3%. In other words, regardless of when the Federal Reserve resumes cutting interest rates, under normal circumstances, there is only a maximum of 1.5% room for rate cuts. Due to the limited "ammunition", the Federal Reserve cannot significantly cut interest rates when the inflation rate has not reached the target, which may lead to the need for significant rate hikes in the future to suppress inflation. Therefore, even if there is a rate cut in September, it does not mean that there will definitely be further rate cuts at future meetings. This week, it is expected to fluctuate between 3320 and 3380. With expectations of a rate cut in September, gold prices lack a strong reason to fall sharply. Moreover, a significant decline would attract capital inflows, which is unfavorable for short sellers. Conversely, as the Federal Reserve will not hold its interest rate meeting until mid-September, even if gold prices rise sharply now to reflect the upcoming rate cut, it is difficult for them to remain at a high level. Therefore, in the short term, the key support levels for gold prices are $3,350 and $3,343. The broader range of fluctuation is expected to be between $3,320 and $3,380, and it is highly likely that the prices will fluctuate within this range this week. The above content is for reference only and does not constitute investment advice. MTF Special Analyst Zheng Guangfu

2025-08-27
"Gold prices are expected to remain in a range-bound pattern in the short term." 26/8/2025 9:32 Completed. Yesterday, the gold price fluctuation narrowed significantly, with the high-low range being just over 16 dollars. As seen from the hourly chart, the gold price bottomed out at 3326 dollars in the early New York session and then rebounded. Before the New York midday, it reached a high of 3376 dollars. However, it failed to break through the high of last Friday and instead turned downward. In the early Asian session today, it dropped to 3354 dollars, slightly testing the 38.2% retracement level of the biggest increase since last Friday. Although the gold price later rose sharply to 3386 dollars, it soon returned below 3380 dollars. Employment data influence monetary policy. Even though the Federal Reserve is highly likely to cut interest rates in September, there are still more than three weeks until the interest rate meeting. During this period, the economic data released by the United States still leaves room for uncertainty at the end of the meeting next month. In particular, the August non-farm payroll report to be released on September 5 and the August CPI to be released on September 11 are both important considerations for the Fed's monetary policy decisions. However, the non-farm payroll report is more closely watched. If the number of new jobs remains below 100,000, it is almost certain that the Fed will cut interest rates in September. Currently, interest rate futures suggest that the Federal Reserve is more likely to keep interest rates unchanged in October and cut them by 25 basis points in December. Additionally, the Federal Reserve will release its latest economic projections after the September interest rate meeting, including its views on the economy, inflation, and employment. The economic projections released by the Federal Reserve in June indicated that the median federal funds rate is expected to be 3.6% and 3.4% in the next two years, higher than the 3.4% and 3.1% projected in March, with a long-term target of 3%. In other words, regardless of when the Federal Reserve resumes cutting interest rates, under normal circumstances, there is only a maximum of 1.5% room for rate cuts. Due to the limited "ammunition", the Federal Reserve cannot significantly cut interest rates when the inflation rate has not reached the target, which may lead to the need for significant rate hikes in the future to suppress inflation. Therefore, even if there is a rate cut in September, it does not mean that there will definitely be further rate cuts at future meetings. This week, it is expected to fluctuate between 3320 and 3380. With expectations of a rate cut in September, gold prices lack a strong reason to fall sharply. Moreover, a significant decline would attract capital inflows, which is unfavorable for short sellers. Conversely, as the Federal Reserve will not hold its interest rate meeting until mid-September, even if gold prices rise sharply now to reflect the upcoming rate cut, it is difficult for them to remain at a high level. Therefore, in the short term, the key support levels for gold prices are $3,350 and $3,343. The broader range of fluctuation is expected to be between $3,320 and $3,380, and it is highly likely that the prices will fluctuate within this range this week. The above content is for reference only and does not constitute investment advice. MTF Special Analyst Zheng Guangfu


