
 en-US
en-US 

 Telegram
 WeChat

2026-07-24
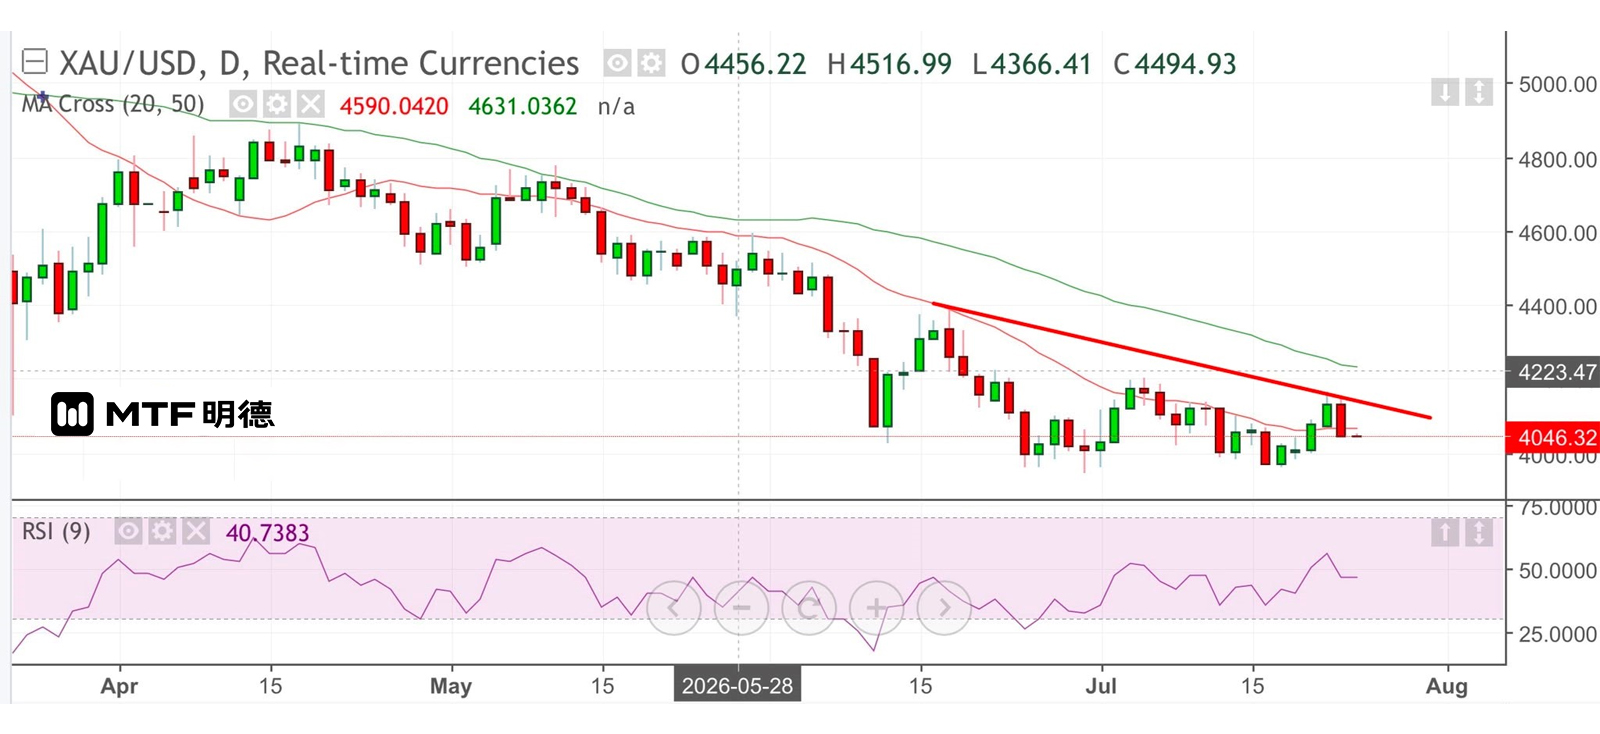
"Gold Price Reverses Sharply, But Double Bottom Pattern Unchanged" Completed on 24/7/2026 at 10:21 Yesterday, oil prices surged while gold prices sharply declined. The main reason was that Houthi rebels in Yemen, backed by Iran, used drones and missiles to attack two Saudi Arabian oil tankers in the Red Sea and simultaneously blockaded the Bab el-Mandeb Strait. This waterway is a crucial passage linking the Gulf of Aden to the Red Sea, through which 12% of global crude oil exports transit via the Suez Canal. With the strait now blocked by Houthi forces, crude oil supply has been disrupted. New York crude oil surged, reaching a high of $94, as concerns over inflation reignited worries about interest rate hikes, weighing on gold prices throughout the day. Spot gold fell below $4,120 early in yesterday's European session, and the decline intensified, dropping to a low of $4,041 during New York midday trading before stabilizing. However, there was no strong rebound, and in this morning's early Asian session, it peaked at only $4,050.75. Yesterday's sharp drop in gold prices prevented it from closing above the 20SMA (currently around $4,068) for three consecutive trading days, but did not break the double-bottom pattern on the daily chart. Now we need to watch whether Trump responds with strong measures—I believe that either the U.S. or Israel may launch a military strike against the Houthi forces, reopening the Bab el-Mandeb Strait. This would likely cause oil prices to decline and gold to rebound again. I still expect $4,000 to remain a strong support level for gold, and in the short term, prices are likely to fluctuate between $4,000 and $4,210. The above information is for reference only and does not constitute investment advice.
2026-07-23
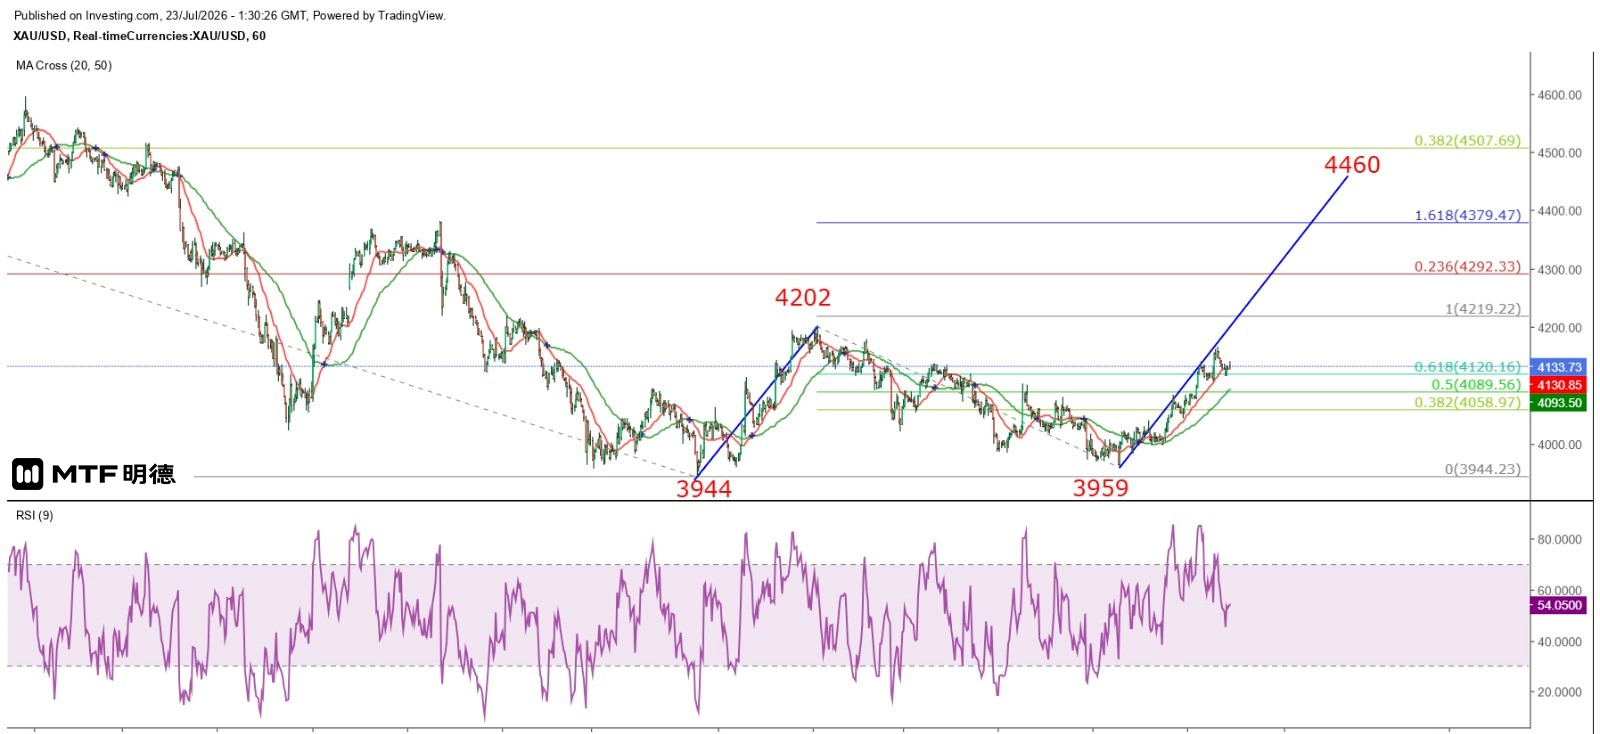
Gold Price Expected to Continue Rising—Buy Bias Recommended July 23, 2026, 9:29 AM As expected, gold prices have maintained an upward trend. From the daily chart perspective, spot gold has closed above the 20-day SMA (currently around 4075) for two consecutive trading days. Although it had previously closed above this level for two days in early July, only to fall back below on the third day and resume its downward momentum, today's close above the 20-day SMA strengthens the likelihood of a strong rebound. However, the next key resistance remains at the 50-day SMA (currently around 4243). A breakout above this level could signal a reversal of the downtrend that began in early March this year. Moreover, gold prices on July 17 showed a relatively high low (not below the June 30 low). According to wave theory, waves 1 and 2 have already formed, and we are now entering a strong upward third wave. If the rise in wave 3 equals 1.618 times the gain of wave 1, gold could climb to $4,379.47, with wave 5 potentially testing $4,500. Using a simple double-bottom measurement method, gold could also rise to $4,460. From the hourly chart, if measured by Fibonacci extension levels, gold could rise to $4,219.22 if the upward move since July 17 reaches 100% of the gain from June 30 to July 6. If the current price action is considered to be in Wave 3, any pullback should be viewed as a buying opportunity. Whether investors choose to capture potential profits during these corrections depends on their risk appetite and market responsiveness. Otherwise, it may be wiser to focus on following the broader trend with lower risk, as trading both sides could lead to losses outweighing gains. The above information is for reference only and does not constitute investment advice.
2026-07-22
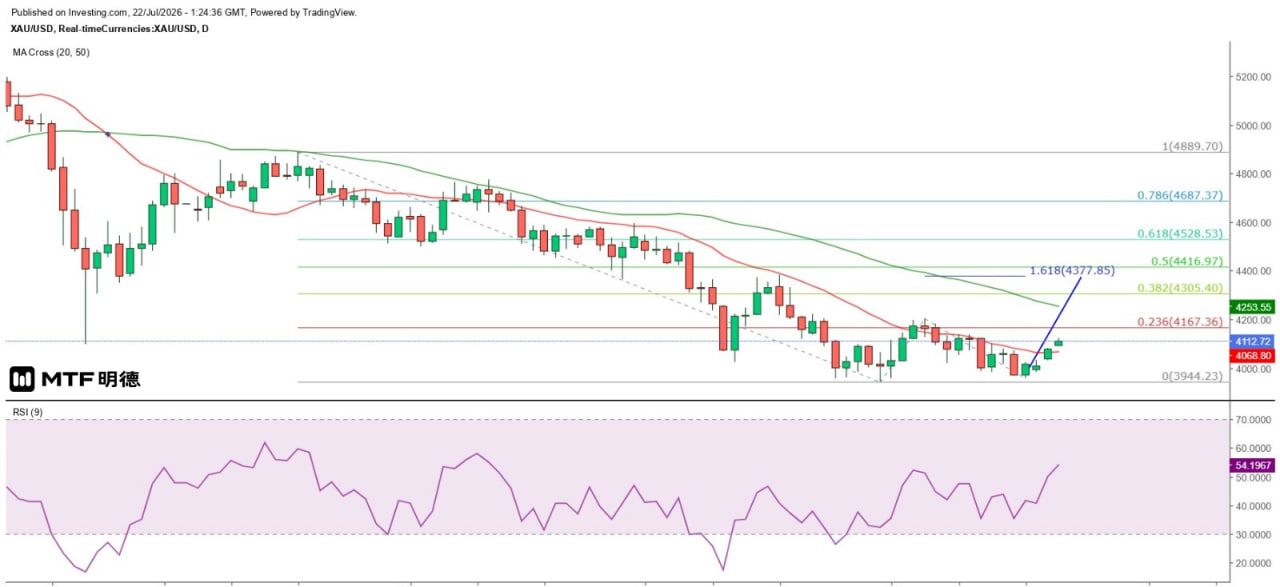
Gold Price Likely to Have Formed an Upward Trend July 22, 2026, 9:22 AM U.S. President Trump suggested that Iran may have transferred key components needed for nuclear weapons production to Qom, and indicated that the U.S. would soon launch a major strike on the region. In response to recent developments in U.S.-Iran relations, the foreign exchange market reacted sharply, with non-U.S. currencies continuing to decline. The euro fell back toward 1.14 against the dollar, while the pound dropped below 1.34 against the dollar, and the dollar surged to around 163 against the yen. Conversely, both oil and gold prices rose simultaneously—crude oil rebounded above $85, and spot gold prices jumped sharply in early Asian trading today, surpassing the $4,100 level. As seen on the daily chart, New York crude oil broke above the 50SMA (currently around 83.5) yesterday, with significant resistance expected near $88.26. Spot gold, as anticipated, successfully challenged $4,110, rising as high as $4,115.84. On the daily chart, gold also broke above the 20SMA (currently around $4,069) yesterday. Earlier it was noted that gold had been closely tracking the 20SMA downward recently, indicating its readiness for an upward breakout—exactly as expected. The key issue currently is how oil and gold prices would react if the U.S. military launched a larger-scale attack on Iran. In theory, if the U.S. attacks Iran again, it could eventually reopen the Strait of Hormuz shipping lanes, leading to a drop in oil prices. Meanwhile, gold prices would likely continue rising due to persistently high global inflation rates. Ultimately, the outcome will depend on whether the Federal Reserve shifts toward a more hawkish monetary policy—should it tighten policy to combat inflation (via interest rate hikes), gold prices would face downward pressure. As seen on the daily chart, gold has formed a higher bottom, signaling the end of the downtrend since mid-April this year. The market is now likely to move in a sideways-upward direction, with an upward trend already established. Gold is expected to further test the Gann 90-degree angle at $4,210, with the next target being the 50SMA (currently around $4,253). Ultimately, resistance may emerge only when prices reach $4,417, as $4,410 lies at the Gann 270-degree vertical angle. The above information is for reference only and does not constitute investment advice.
2026-07-21
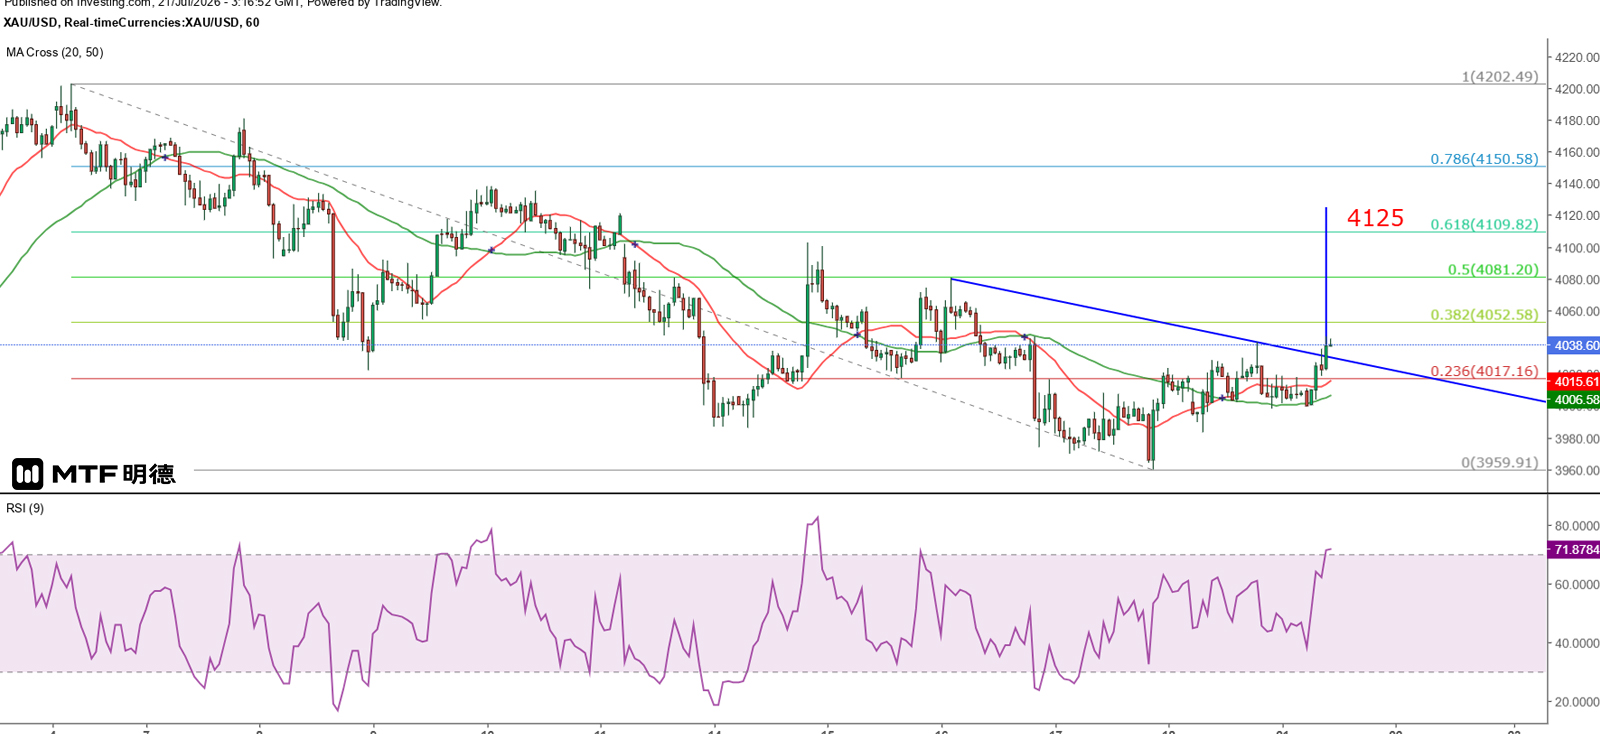
"Gold Price: Intraday Strategy Suggests Buying on Dips" – Completed on 21/7/2026 at 11:13 The situation between the U.S. and Iran has seen another shift. According to Fox News, citing senior U.S. officials, President Trump will decide in the coming days whether to escalate military operations against Iran and resume full-scale combat. Officials stated that if a full-scale military campaign resumes, its scale and intensity would far exceed the nine-night airstrikes that began on July 7. On the other hand, an Iranian Foreign Ministry spokesperson confirmed receiving proposals from multiple mediators suggesting a 10-day ceasefire, aimed at finding ways to revive the temporary agreement between the U.S. and Iran. Gold prices rose steadily as expected, breaking above the 50-period SMA on the hourly chart (currently around $4,006) yesterday and reaching a high of $4,040 ahead of New York's open. Although it quickly pulled back afterward, it held firm above the 50-period SMA in a narrow consolidation range during New York trading hours. Today, although gold briefly tested below $4,000 at Asian market open, it swiftly recovered and surged higher, surpassing yesterday’s high to reach $4,043.65. If Trump signals a pause in further military actions against Iran, a significant rise in gold prices is expected, with $4,110 becoming the first major target. A break above this level would likely push prices toward $4,210. Gold prices are expected to continue rising intraday along the 20-period SMA on the 5-minute chart (currently around 4030), with the 50-period SMA (currently around 4021) serving as a key support level. My trading strategy suggests buying on pullbacks, entering when prices retrace to the 20SMA. If gold breaks below this line and tests the 50SMA, I would consider exiting on a rebound to the 20SMA, or even switch to a reversal short position. There are already signs that gold is entering a trending phase; investors should patiently wait for optimal entry and exit points. Without clear reversal signals, avoid making speculative moves or acting out of fear by entering too early or taking profits prematurely. The above information is for reference only and does not constitute investment advice.
2026-07-20
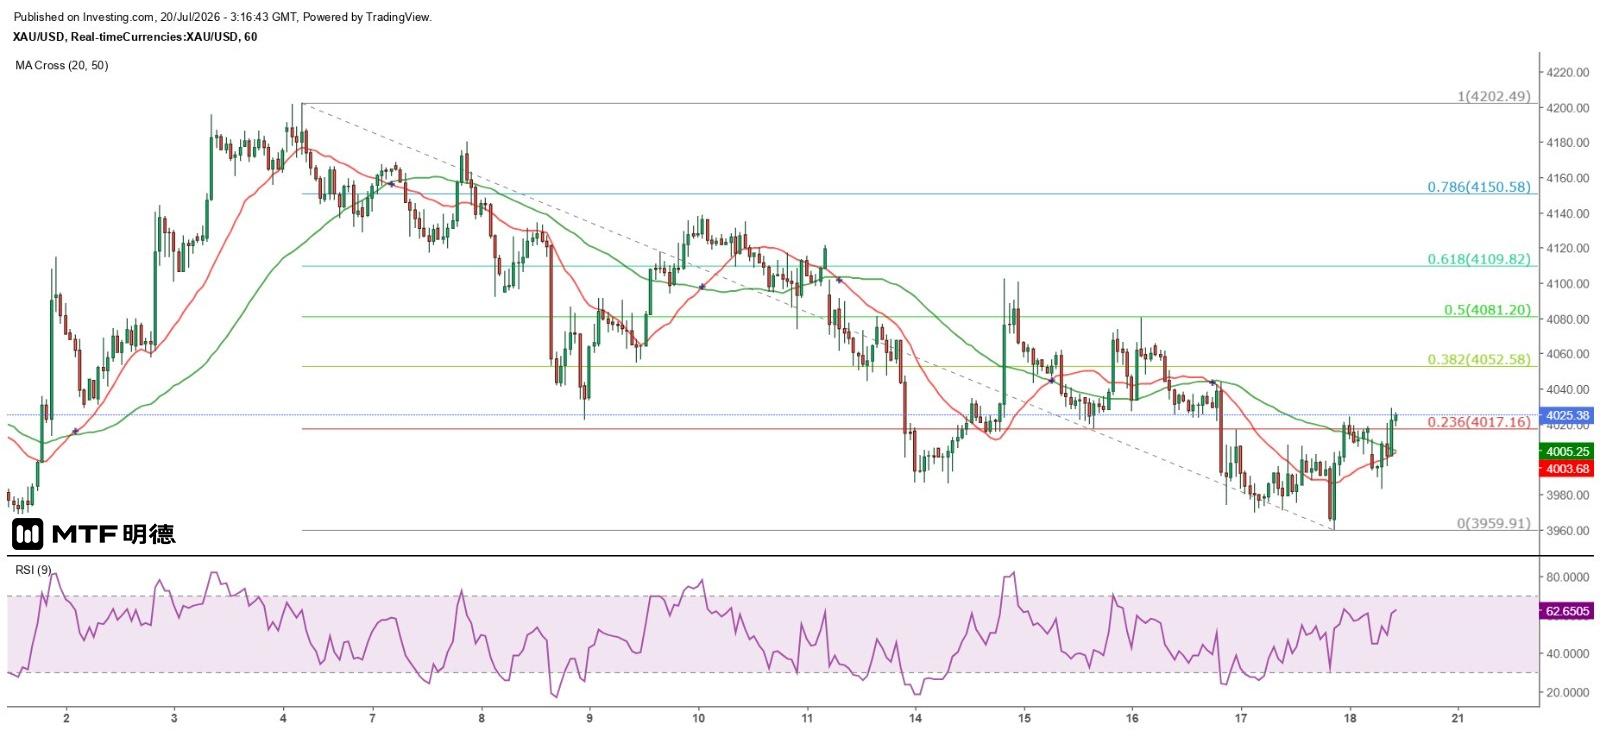
Gold prices expected to stage a short-term rebound wave Completed on 20/7/2026 at 11:15 Following the temporary suspension of the ceasefire agreement between the United States and Iran, military clashes have resumed. The U.S. launched a new round of airstrikes, while Iran targeted multiple U.S. bases in the Middle East. Reports indicate that three American soldiers were killed within two days. In response, U.S. forces carried out another airstrike against Iran late at night—marking the ninth consecutive nighttime attack by the U.S. on Iran. Meanwhile, Iranian media, citing sources from the Islamic Revolutionary Guard Corps, reported that no vessels are currently allowed to pass through the Strait of Hormuz, and any ship attempting to cross will face Iranian strikes. They further stated that as long as the U.S. continues hostile and provocative actions, the Strait of Hormuz will remain closed, and Iran will not issue passage permits to any vessel. Oil prices surged in today's Asian session, with New York crude futures briefly reaching $84.6 before slightly retreating to around $83. Gold reacted differently this time; although it opened lower and continued to decline early in the morning, spot gold rebounded after dropping to $3,983.04. On the hourly chart, gold broke above the $4,000 level with a bullish engulfing pattern, followed by further gains, temporarily reaching a high of $4,028.72. In fact, after hitting a low of $3,959.91 in early Friday trading in New York, gold had already staged a strong recovery on the hourly chart with another engulfing pattern, closing at $3,997.47 and briefly surpassing the $4,000 mark. Gold is likely to see further short-term upside momentum. From the hourly chart, gold remains in a downward trend since July 6, although there have been several rebounds during this period. The rebound from the lows on July 8 and 14 reached approximately $116 to $117. Based on yesterday's low of $3,959.91, gold should be able to rise to around $4,076—approaching the 50% retracement level of the entire downtrend at $4,081.20. From a Gann square perspective, gold has now re-entered above the 90-degree angle at $4,010. If it can hold steady above this level, it may further challenge the 135-degree resistance at $4,110 in the short term. However, this resistance is relatively light, and gold could potentially advance toward the 180-degree level near $4,210 before encountering significant resistance. For today, key support levels are expected at $4,005 and $4,000. The above information is for reference only and does not constitute investment advice.
2026-07-17
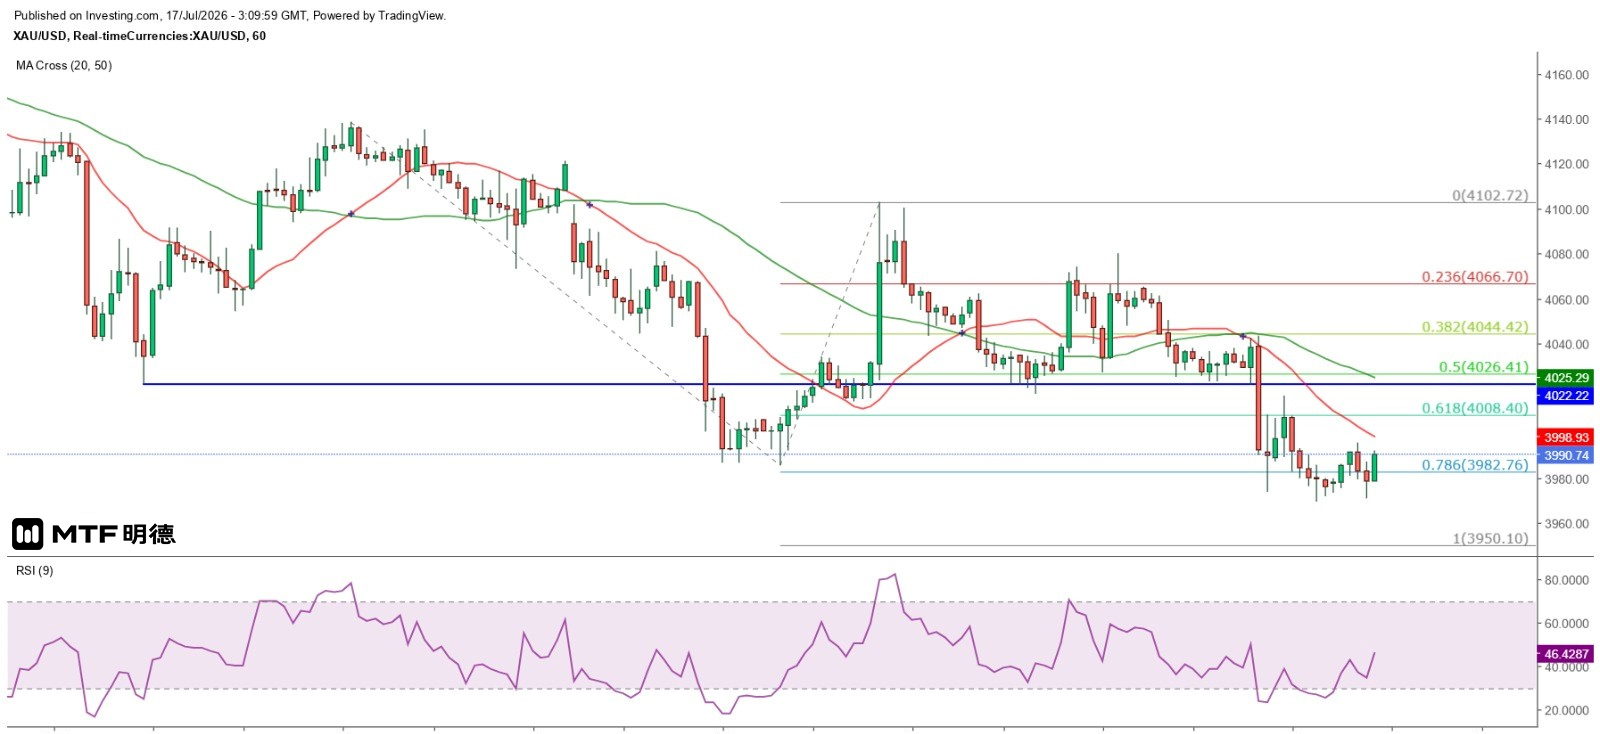
Gold price expected to hit bottom at $3,800 in the medium term July 17, 2026, 11:08 AM As expected, gold prices broke below $4,000 and reached the measured downside target of $3,987 based on the TD line. After testing $3,974 early in New York trading yesterday, spot gold rebounded to a high of $4,016.64 before declining again. It later made a new intraday low at $3,969.78. Although it briefly rose to $3,996.06 this morning in Asian markets, it clearly faced resistance from the 20-period SMA on the hourly chart (currently around $4,003), prompting another decline. The price stabilized temporarily after touching the $3,970 level. For now, the decline in gold prices is primarily driven by the high likelihood of a new U.S. military attack on Iran in the near term. It would be inaccurate to attribute the price drop solely to profit-taking, as gold has shown a volatile downward trend since Tuesday, following a noticeable rise on Monday—indicating fresh selling pressure from new funds entering the market. In terms of short-term trends, gold may only find a bottom and rebound next Monday. However, if Trump decides to launch an attack on Iran this weekend, the chances of a sharp drop in gold prices on Monday are very high, potentially pushing prices down to the Gann square level at $3,810 before stabilizing. The monthly chart of gold shows that the 20SMA currently stands at approximately $3,820. Since gold broke above this level in October 2022, it has only closed below it once—specifically in September 2023. Therefore, the 20SMA on the monthly chart can be regarded as a key long-term support level for gold prices. Based on this, strong support is expected around $3,800, which should be sufficient to trigger a significant mid-term rebound. If the rebound targets 50% of the decline from the historical high, gold could rise to $4,777.78. Additionally, considering the largest upward move since the November 2022 low, gold has now retraced over 38.2% from its peak (to $4,075.37). A 50% correction would bring prices down to $3,605.82, but this scenario appears unlikely at present. Instead, gold is more likely poised to initiate a strong mid-term recovery rally. The above information is for reference only and does not constitute investment advice.
2026-07-16
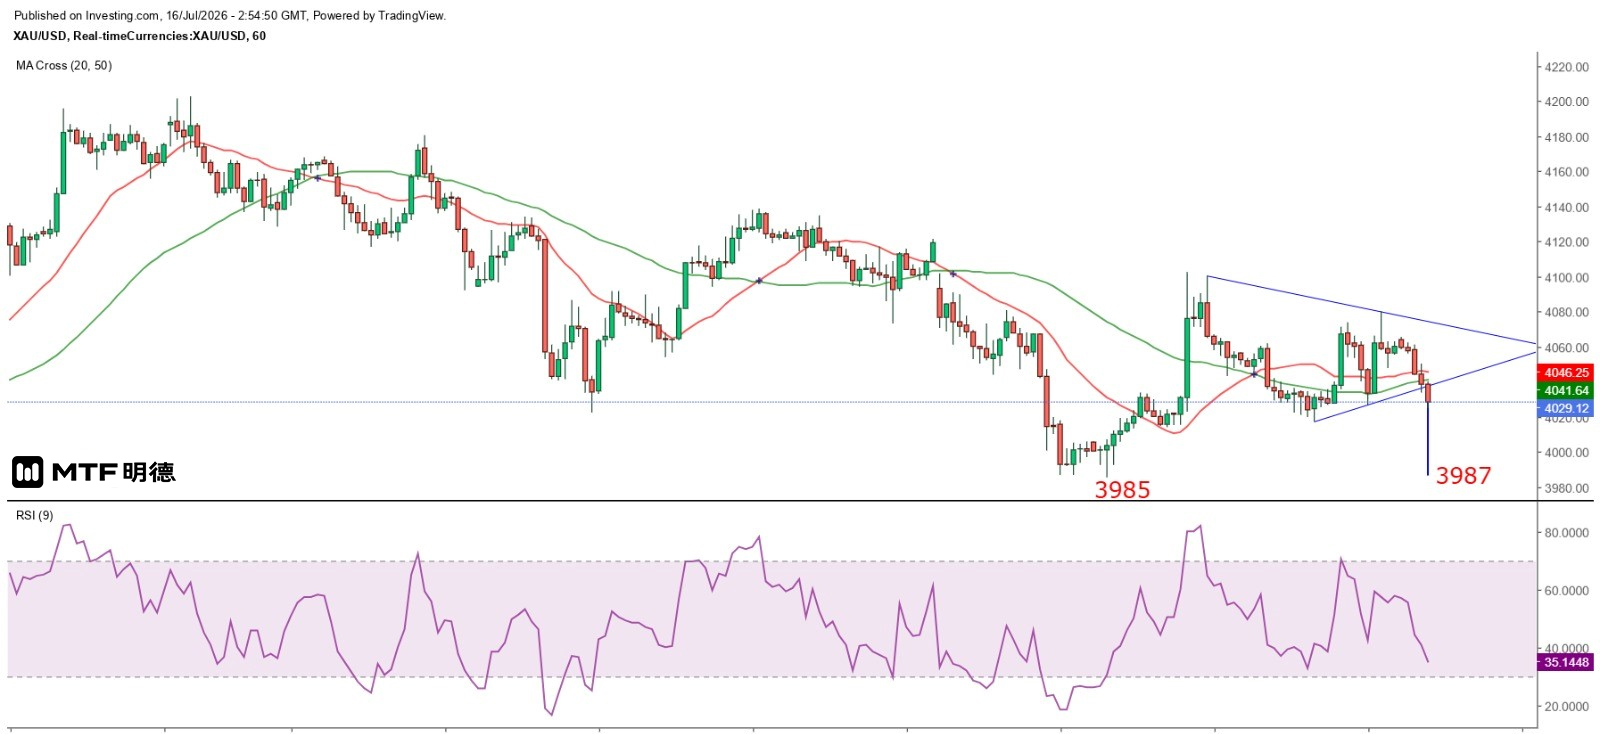
"High Chance of Gold Price Breaking Below $4,000 in the Short Term" – Completed on 16/7/2026 at 10:54 The U.S. plans to intensify its military actions against Iran, including expanding airstrikes to target the "Koh-e-Sar" tunnel complex linked to Iran's nuclear program, as well as seizing Kish Island and other Iranian islands along the Strait of Hormuz. This indicates that Trump aims to achieve two objectives: first, to destroy Iran's nuclear facilities; second, to secure the Strait of Hormuz shipping lanes so that vessels passing through are no longer vulnerable to Iranian attacks. Controlling Iranian islands along the strait would enable this goal, while capturing Kish Island would effectively grasp Iran's strategic lifeline, thereby forcing Iran into a nuclear deal with the United States. Tensions between the U.S. and Iran have intensified, fueling market risk aversion. Gold prices, which had recently risen on the back of easing U.S. inflation, are now seeing profit-taking. After reaching a high of $4,080 during New York's midday trading yesterday, gold weakened and continued to decline in early Asian trading today, currently trading at a low of $4,026.16. It should be noted that markets have already begun pricing in an increased likelihood of U.S. military action against Iran. If such actions materialize, gold is expected to fall below the $4,000 level, with higher chances of testing $3,910, and potentially even dropping further toward the Gann square angle level at $3,810 before finding support. On the 5-minute chart, gold prices experienced a strong rebound after yesterday's London close. The subsequent pullback from the high of $4,080.19 was nearly 61.8% of the rebound wave, and the following rally only reached about 50% of the prior decline, indicating weak momentum in the price movement. Currently, gold appears to have formed a minor double bottom around the $4,026–$4,027 level. However, on the hourly chart, gold has already broken below the TD ascending trendline, with a projected downside target at approximately $3,987—close to the July 14 low of $3,985. It is expected that gold will find stronger support only when it approaches this level over the next two days. Nevertheless, given the possibility of U.S. military action against Iran this weekend, gold could gap lower on Monday, potentially falling near $3,910 before stabilizing. The above information is for reference only and does not constitute investment advice.
2026-07-15
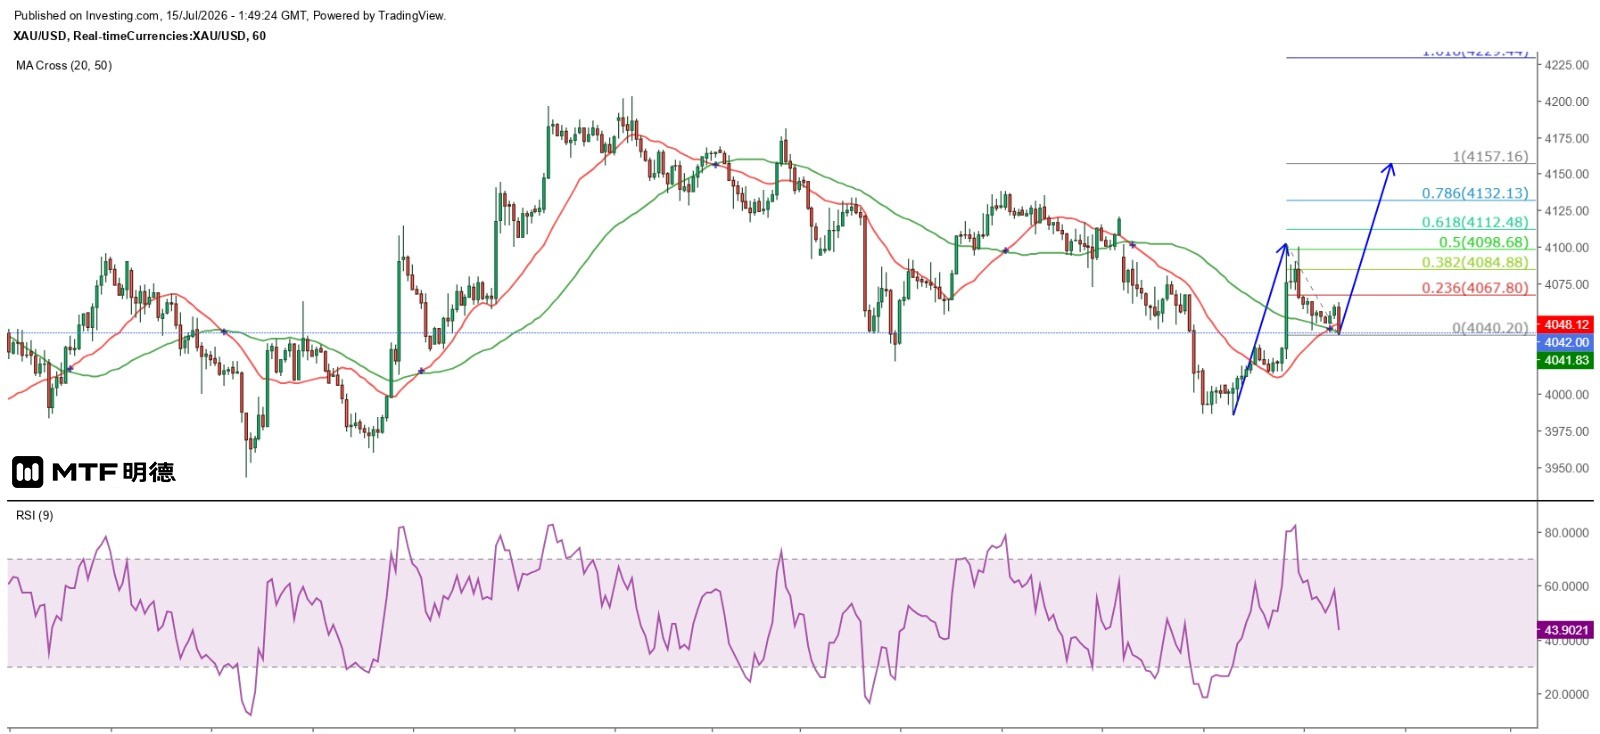
"Gold Price Forms a Short-Term Rising Flag Pattern" Completed on 15/7/2026 at 9:43 In response to events and data over the past two days, gold prices indicate that the market's main driver remains the U.S. interest rate trend, while the conflict between the U.S. and Iran in the Middle East only occasionally exerts temporary effects on gold. Yesterday, the U.S. released its June CPI data, showing that year-on-year inflation dropped sharply from 4.2% to 3.5%, while core CPI fell from 2.9% to 2.6%. On a month-on-month basis, overall inflation declined by 0.4%, whereas core inflation remained unchanged. All figures came in below expectations, prompting the market to reassess the likelihood of further Federal Reserve rate hikes this year. CME's FedWatch predicts that the probability of the Federal Reserve keeping interest rates unchanged on July 29 has sharply risen from 58.3% to 84.5%, while the chance of a 25-basis-point rate hike in September has slightly declined from 51.2% to 50%. Meanwhile, the likelihood of maintaining current rates has significantly increased from 24.9% to 42.2%. This makes sense, as inflation at 3.5% remains above the Fed's 3% upper threshold. However, if crude oil prices remain below $80 per barrel in July, year-on-year oil price gains would further moderate, potentially bringing inflation down to 3% or lower. In such a scenario, the possibility of a rate hike this year would be eliminated, which could support gold prices. After the release of U.S. inflation data, gold prices surged sharply, with spot gold rising from $4,028 to $4,089.75, then further climbing to $4,102.72 before retracing. It found support at around $4,069 and strengthened again, forming a double top after reaching as high as $4,100 ahead of London's close, which led to increased selling pressure. Prices later stabilized after dropping to a low of $4,043.2 in late New York trading, subsequently fluctuating within a range of approximately $4,048 to $4,060. As seen on the hourly chart, gold remains in a downward trend over the past 76 days. However, since yesterday's New York session, the price has formed an ascending flag pattern. Measured by a 100% Fibonacci extension, gold is expected to rise toward $4,157.16 before facing resistance and potentially retracing. On a larger time frame, there is potential for gold to form a double-bottom reversal with the June 30 low, with the July 6 high of $4,202.49 acting as the neckline and serving as the next target for future price action. The above information is for reference only and does not constitute investment advice.
2026-07-14
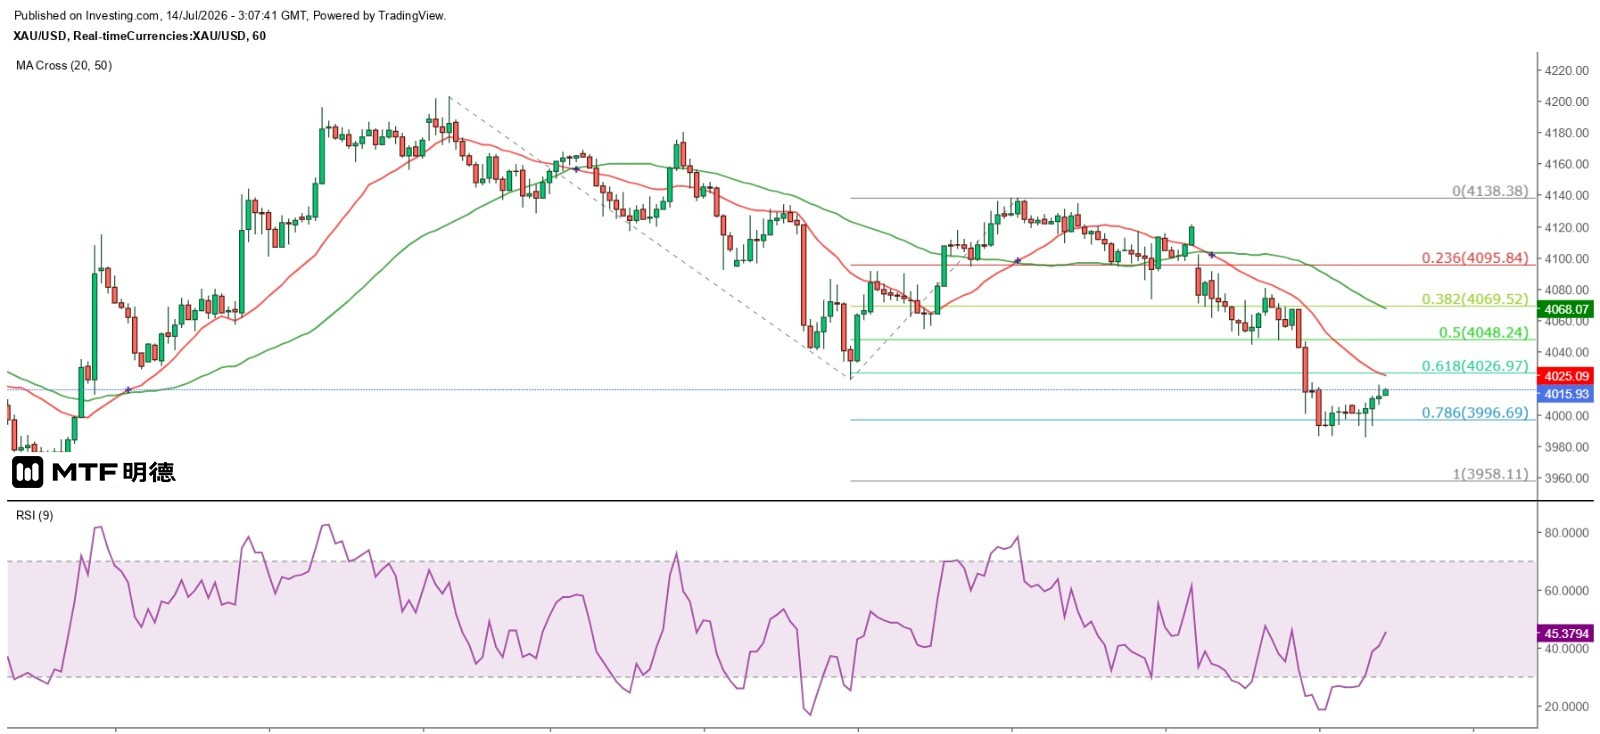
Gold prices are expected to fluctuate around the $4,000 level. July 14, 2026, 11:07 AM – Finalized Gold's performance has largely met expectations. Although spot gold dipped below the July 8 low of $4,022 and even tested the psychological $4,000 level, it did not see a further sharp decline. After hitting a low of $3,986.71 at London's close yesterday, prices stabilized immediately, and bearish momentum failed to gain traction in New York trading. Although gold briefly fell to $3,985.76 during early Asian trading today—testing yesterday’s low—the hourly chart shows that prices ultimately reversed course within an hour, rising back above $4,000. Measuring the hourly chart's movement since July 6 using Fibonacci extension levels, gold has already declined by slightly more than 78.6% from its peak on July 10. If the decline reaches 100%, gold could fall to $3,958.11. On the hourly chart, gold's rebound since yesterday has been capped by the 20SMA at 4,027, suggesting that as expected, a recovery wave may not occur until this Thursday. Since $4,010 lies at the 90-degree angle of Gann's square, it serves as a key support (or resistance) level for gold prices. A break below this level is expected to intensify the downward trend. Tonight, Federal Reserve Chair Wash will testify before the House committee, and the U.S. Department of Labor will release June's CPI data today. Gold prices are likely to fluctuate around the $4,000 level. However, if prices drop near $3,958.11, bearish positions should consider taking profits. This is because the decline has already reached a 100% Fibonacci extension, and the price is approaching the lowest point since the peak in January—$3,944.23. A break below that level would create a triple bottom divergence between the daily chart and the 9RSI, potentially triggering a stronger rebound in the future. The above content is for reference only and does not constitute investment advice.
2026-07-13
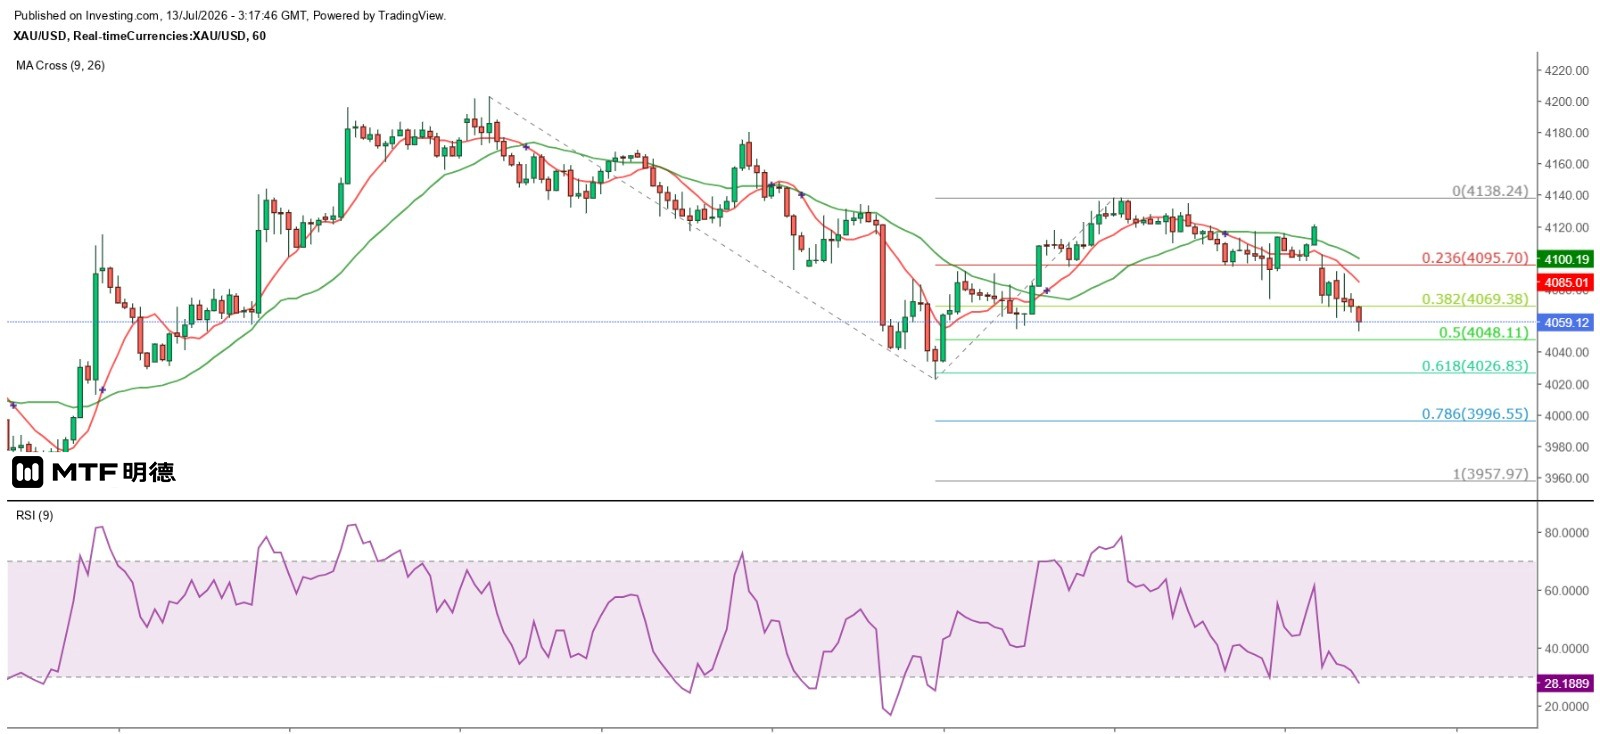
"Gold Price Under Short-Term Pressure, May Form Double Bottom Rebound" 13/7/2026 11:16 Completed Military conflict between the U.S. and Iran has reignited in the Middle East, with an explosion occurring near a U.S. military base in Bahrain. The U.S. Central Command stated it had destroyed dozens of Iranian targets, aiming to weaken Iran's ability to continue attacking international shipping through the Strait of Hormuz. Crude oil prices opened higher in Asian markets, rising as high as $74.64, while gold opened lower, breaking below $4,100 again. Gold prices subsequently continued to decline, falling to a low of $4,061 before briefly rebounding to $4,077.50, only to drop back below $4,070 later. Federal Reserve Chair Wash will testify before the House committee tomorrow, on the same day that the U.S. releases its June CPI data. Core CPI is expected to remain up 2.9% year-on-year, while overall CPI is projected to rise slightly less than 4.2% year-on-year due to a sharp drop in oil prices. Nevertheless, inflation remains significantly above the target level. Markets anticipate that Wash may hint at the possibility of a rate hike during the hearing, and if this signals a shift in monetary policy, gold prices could face downward pressure. From the daily chart, although gold prices broke above the 20SMA (currently around 4109) earlier this month, they failed to close above this level for three consecutive trading days and have since retreated below it. At the start of this week, prices are likely to face pressure due to these factors. However, last week gold repeatedly approached the 50SMA (currently around 4146), differing from previous trends, indicating a potential upward breakout. Once short-term influences subside, gold is still expected to rebound significantly. In the short term, prices may test the prior low of $4022 as support, but there is a chance of forming a double bottom. If gold continues to decline, a bottom could be reached by Thursday with a subsequent rebound. Unless the Federal Reserve's monetary policy changes noticeably, $4000 will remain a strong psychological support level, while the 50SMA on the daily chart acts as the primary resistance for any bounce. The above information is for reference only and does not constitute investment advice.
2026-07-10
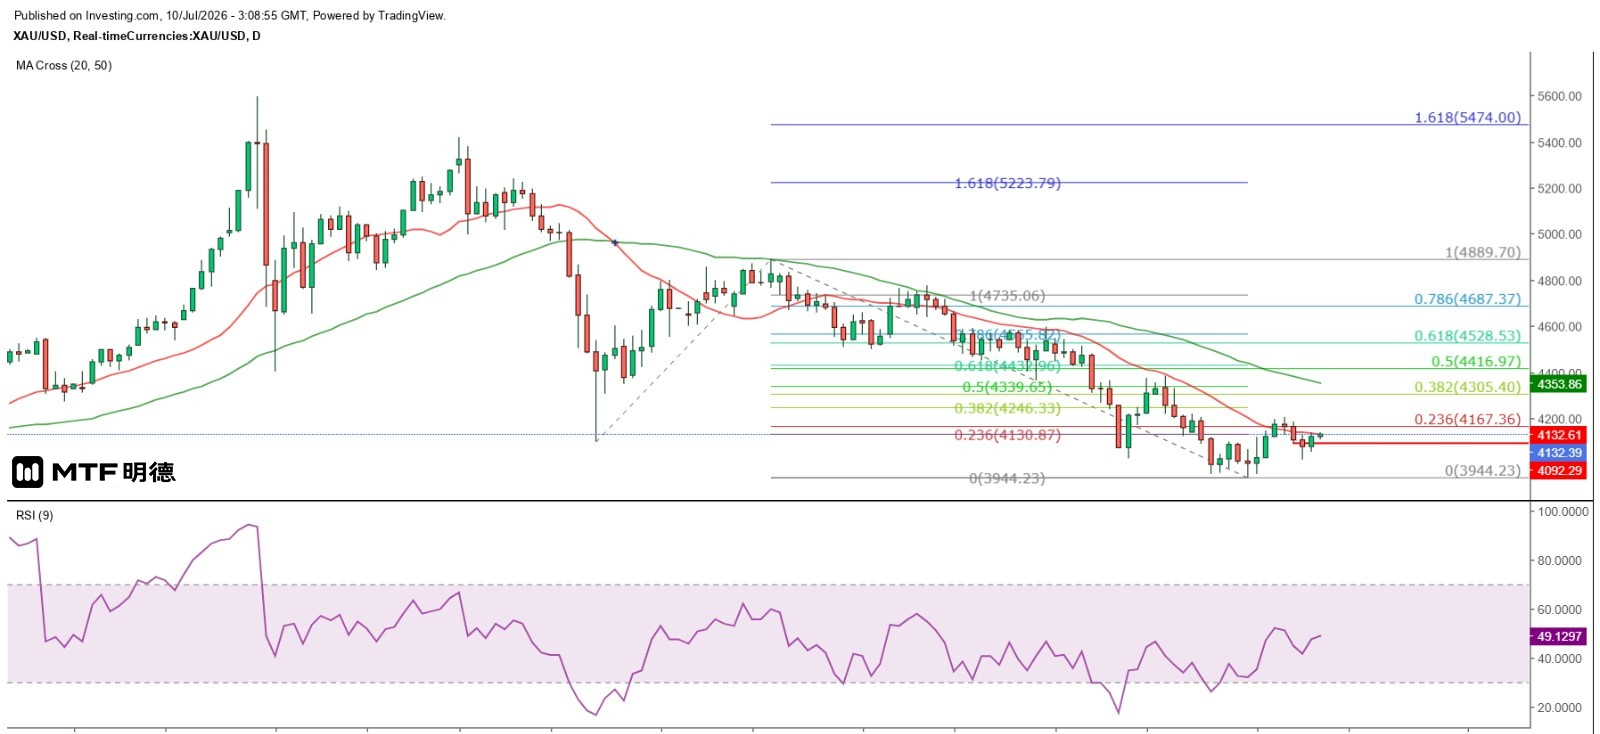
Gold Prices Expected to Launch a Major Rebound Wave October 7, 2026, 11:07 AM Gold prices continue to rise, reflecting a gradual easing of market concerns over the U.S.-Iran situation. Investors are once again positioning themselves according to their own needs. Trump's inconsistent stance also makes investors hesitant to get too close—particularly since he believes that a large-scale, prolonged war between the U.S. and Iran is unlikely, implying that Middle East tensions will not severely impact financial markets. Moreover, as we move into the second half of the year, Trump must begin preparing for the midterm elections. Although I believe he no longer cares about winning or losing, successfully brokering a nuclear deal with Iran would greatly help Republicans maintain control of Congress. Gold prices have shown stronger performance than expected. After breaking above $4,110 during yesterday's early New York session, spot gold has held firmly above that level. This morning in the early Asian trading session, it briefly dipped to $4,109 before quickly recovering and returning above $4,110. On the hourly chart, gold reached a high of $4,138.38 last night—representing a rebound from Wednesday evening’s low of $4,022, which already exceeds 61.8% of Monday’s maximum decline ($4,133.63). Following yesterday’s retest above $4,110, gold spent most of the day consolidating, suggesting it is now poised for a further upward breakout. From the daily chart, gold prices have begun to form a wave pattern with each successive wave higher than the previous. Recently, gold has been fluctuating around the 20SMA (currently at approximately 4132), marking the first time since breaking below this level on March 12th that it has consistently tested the 20SMA. Currently, it appears that a major rebound is imminent, with the 50SMA (currently at around 4353) as the next key target. A breakout above this level is highly likely, with the initial upside target at $4,417. Once gold stabilizes above $4,410, the next targets will be $4,660 and $4,735. Investors should therefore pay close attention—once gold breaks above the 20SMA with a strong bullish candlestick, it will signal the start of a significant upward rally. The above information is for reference only and does not constitute investment advice.
2026-07-09
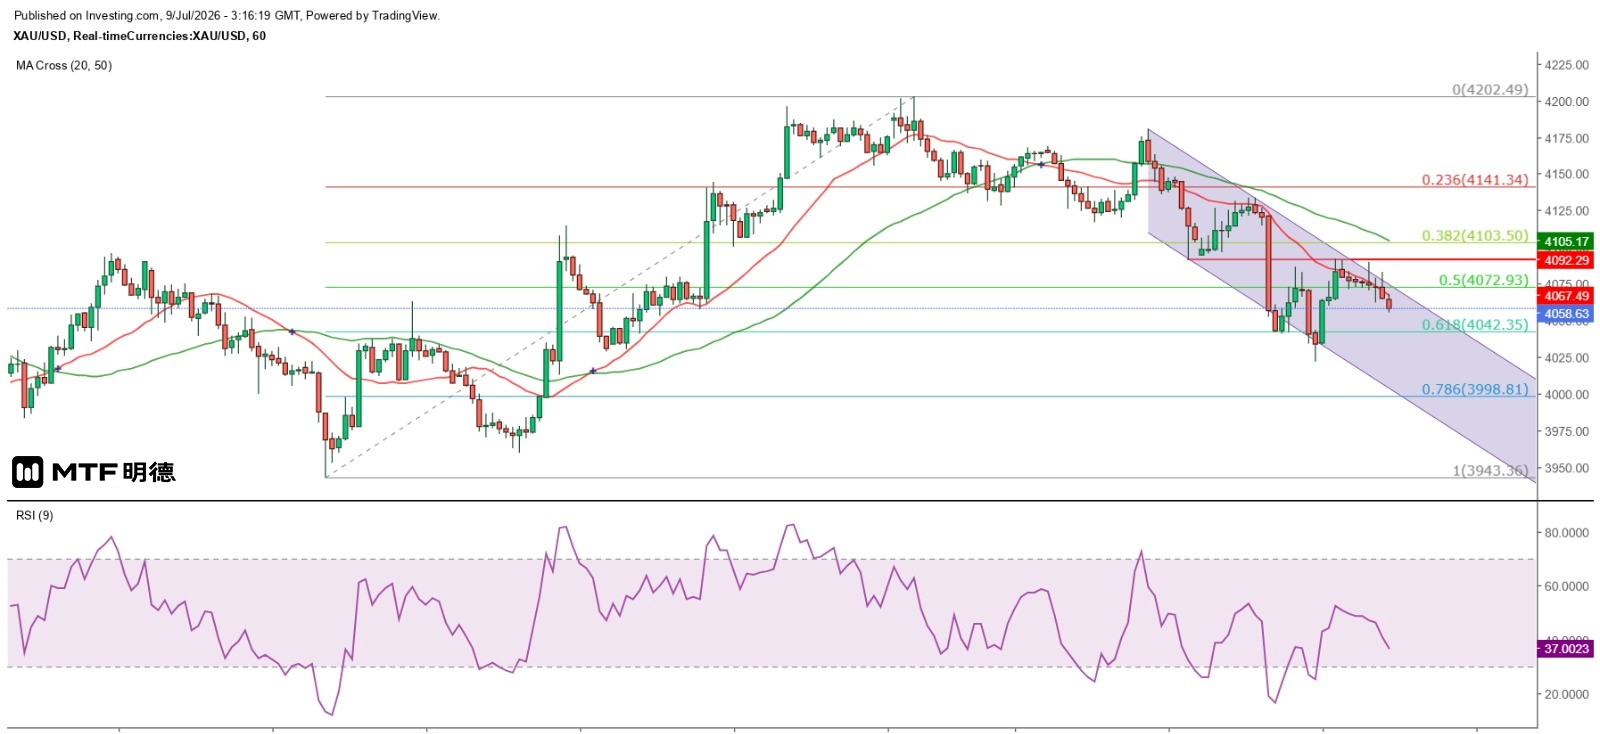
Gold price hits $4,110 as key intraday resistance level September 7, 2026, 11:14 AM Iran attacked vessels navigating in Omani waters, and U.S. forces also carried out strikes against several Iranian targets. The United States stated that Iran had recently launched unjustified attacks on ships transiting this international waterway, and the U.S. will hold those responsible accountable. Foreign media reported that U.S. officials revealed the duration and intensity of America's new actions would depend on Tehran's next move. Amid renewed tensions between the U.S. and Iran, oil prices surged while gold prices sharply declined. Crude oil reached as high as $76 yesterday, while spot gold fell below $4,100, hitting a low of $4,022.22. Although it later rebounded, it remained clearly constrained by the psychological resistance level at $4,100. With the U.S.-Iran situation unlikely to ease in the short term, gold is expected to remain under pressure but may still hold steady above the $4,000 mark. Technically, gold is currently drifting lower along the 20-period SMA on the hourly chart (4068). A further decline could form a double bottom with yesterday's low, and a break below that level would likely create a bullish divergence with the 9RSI. Support at $4,010—aligned with Gann's square at a 90-degree angle—is expected to trigger a strong rebound. Market reaction to escalating tensions between the U.S. and Iran has been relatively muted, so gold is likely to remain within its familiar trading range. However, if the $4,944 level is breached, long positions should consider taking profits. For now, $4,105 to $4,110 remains the key resistance zone for intraday rebounds. The above information is for reference only and does not constitute investment advice.
2026-07-08
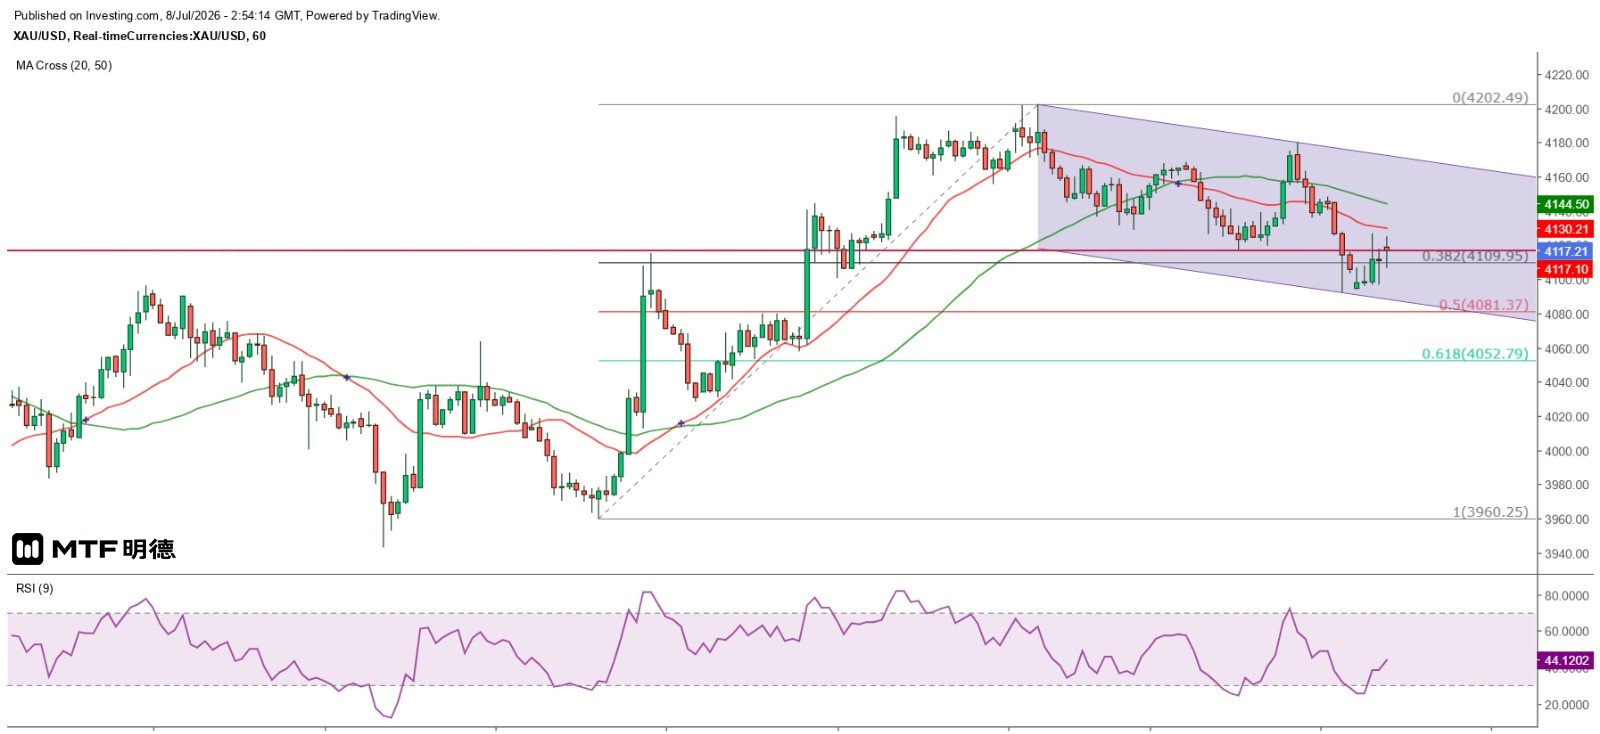
Gold prices still have a high chance of short-term recovery Completed on 8/7/2026 at 10:51 Yesterday, gold prices fluctuated. After touching a low of $4,117 near the start of European trading, spot gold rebounded and briefly rose to $4,180 in early New York trading. However, it subsequently declined steadily, breaching the $4,100 level and falling as low as $4,092. Although prices recovered later, they faced resistance after reaching a high of $4,126.6 this morning. Technically, gold remains clearly constrained by yesterday's low point before European market opening. As seen on the hourly chart, gold's cumulative decline since July 6 has exceeded 38.2% of its maximum gain since July 1, and is just about $11 away from a 50% retracement level. Therefore, a strong rebound is expected today, with gold likely to retest the $4,200 level in the remainder of this week. Conversely, if gold continues its sideways downtrend, it may briefly find support and rebound near $4,080 or $4,050. For now, gold is expected to remain above $4,100 in short-term fluctuations. On the daily chart, gold closed below the 20SMA (4143) yesterday, failing to remain above this level for three consecutive trading days. A move above $4202.67 would be required to confirm an upward reversal. In the short term, prices are expected to fluctuate around the 20SMA, awaiting a breakout opportunity. Additionally, with the daily chart showing divergence as the 9RSI has declined into severely oversold territory, the likelihood of a bullish turn is relatively high. If gold tests but holds above the June 30 low of $3944 in the near term and shows strong reversal signals, a short-term recovery can be anticipated. This could lead to further upward momentum, with resistance likely emerging around $4410. The above information is for reference only and does not constitute investment advice.
2026-07-07
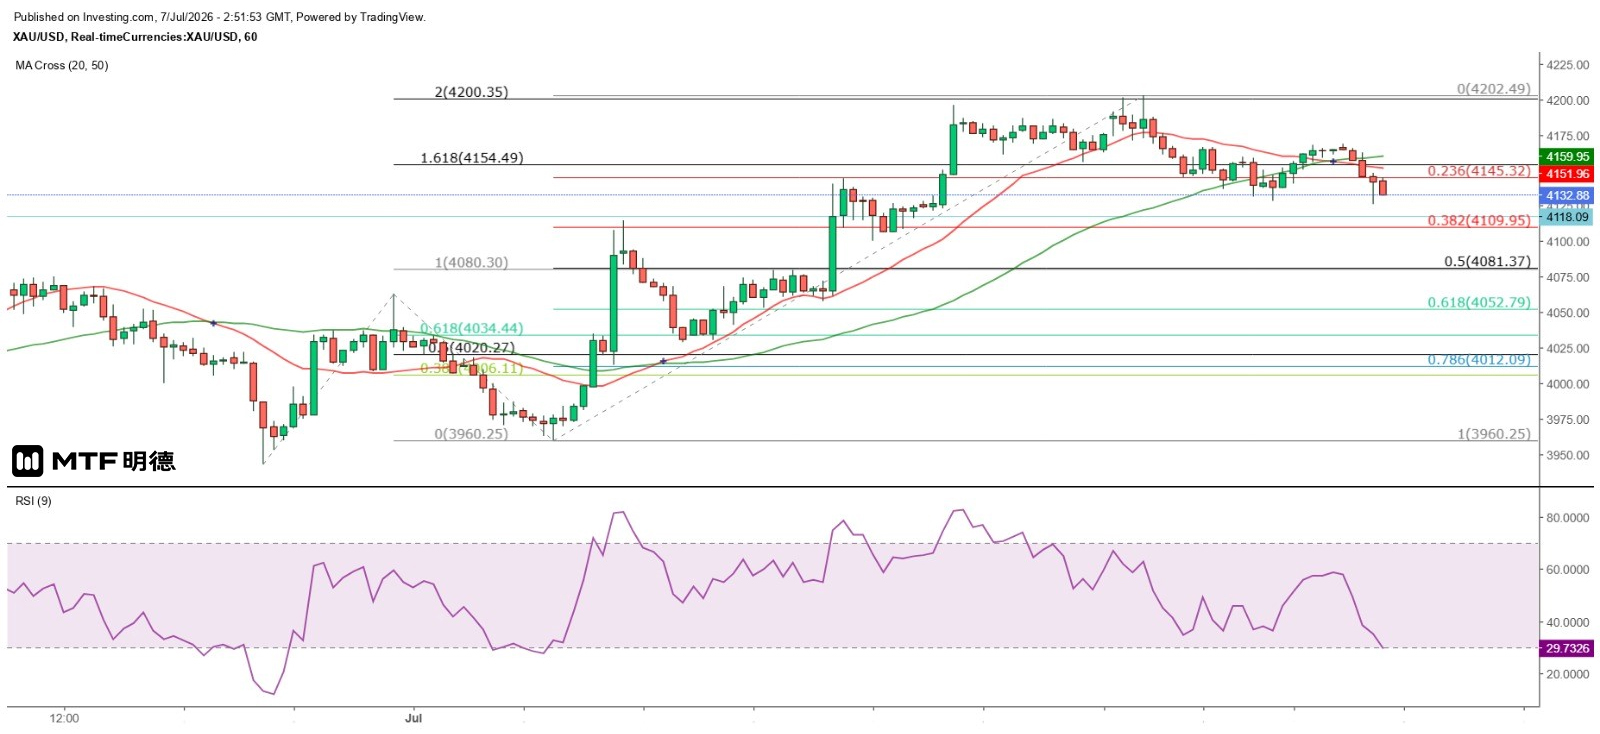
Gold Price Cautions Against Single-Day Reversal Signal Completed on 7/7/2026 at 10:50 As expected, gold prices continued to decline. After rising twice above $4,200 yesterday, the spot price failed to sustain momentum and subsequently fluctuated lower. It dipped as low as $4,128.55 in early New York trading before rebounding to a high of $4,163.75 by the session's close. However, after Asian markets opened today, prices fell again, with the current low reaching $4,126.30. On the hourly chart, gold prices have been gradually forming a lower-wave pattern since yesterday, having already broken below both the 50SMA (4160) and the 20SMA (4152). In the short term, $4081 serves as a key support level. However, calculating a 38.2% retracement of the largest gain since July 1st, prices could fall to $4109.95—very close to the secondary support at the 135-degree angle of Gann's square at $4110. Optimistically, gold may hold above $4110 before launching a rebound. Nevertheless, it is expected to remain capped by $4210, meaning that after any rally, a double top would likely form on the hourly chart, leading to another decline. In other words, the current low being tested will become the neckline support. However, the daily chart tells a different story. Although gold closed with a bearish candle yesterday, it managed to hold above the 20SMA (4142.6) and is currently consolidating near that level again. The overall pattern appears to be forming an ascending flag, suggesting a strong reversal signal could emerge within a single day. If this happens and prices break above yesterday's high of $4202.67, the chances of gold advancing further toward the 50SMA (4383) and the strong resistance at the Gann square 90-degree angle at $4410 would significantly increase. The above content is for reference only and does not constitute investment advice.
2026-07-06
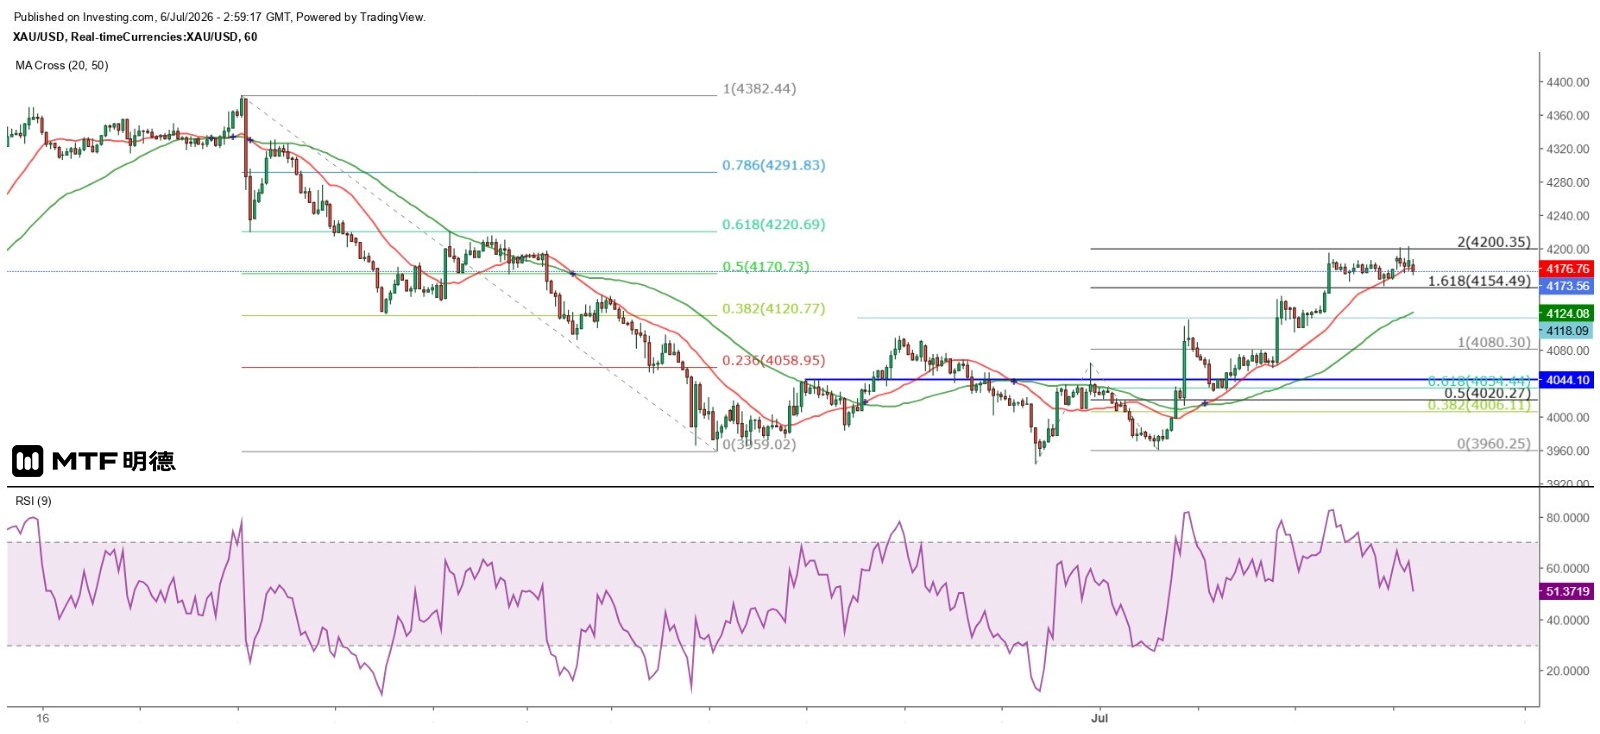
"Short-Term Gold Rally Could End Anytime" – Completed on 6/7/2026 at 10:58 Last Friday marked the U.S. Independence Day holiday, causing a closure of U.S. financial markets and resulting in gold prices trading in a narrow range after European markets reopened. This morning, gold opened with a gap higher. According to the hourly chart, spot gold surged twice above the $4,200 level, reaching a high of $4,202.49. However, it faced resistance around $4,200 and failed to hold above this level after two attempts, subsequently retreating and currently consolidating near the 20-period SMA at $4,176 on the hourly chart. Last Friday, it was noted that gold prices were expected to face strong resistance near $4,210 at the 180-degree angle of Gann's square, with an anticipated upward trend continuing into early this week. The current price movement aligns with this forecast. On the hourly chart, after touching a low of $3,943.36 on June 30, spot gold rebounded to a high of $4,063.41 before correcting downward to a low of $3,960.25, completing a two-wave adjustment and initiating a third wave rally. Based on today's high, the third wave gain slightly exceeds twice the size of the first wave. If a fourth wave correction occurs in the short term, support is expected around $4,063.41. Since the downtrend began on June 18, gold has rebounded by more than 50% of that decline (reaching 4170.73), and the 61.8% retracement level at $4220.69 clearly appears as a significant technical resistance on the hourly chart. Therefore, it is likely that the short-term upward move is nearing its end and will face a substantial correction. The first key support lies at the hourly 50SMA (4124); if this level breaks, prices could test 4080 or even 4063 for further support. On the other hand, note that last Friday gold broke above the daily 20SMA (4157). If gold closes above this line for three consecutive trading days, it may signal the start of a medium-term recovery wave, with the daily 50SMA (4392) becoming a potential target to challenge. The above information is for reference only and does not constitute investment advice.
2026-07-03
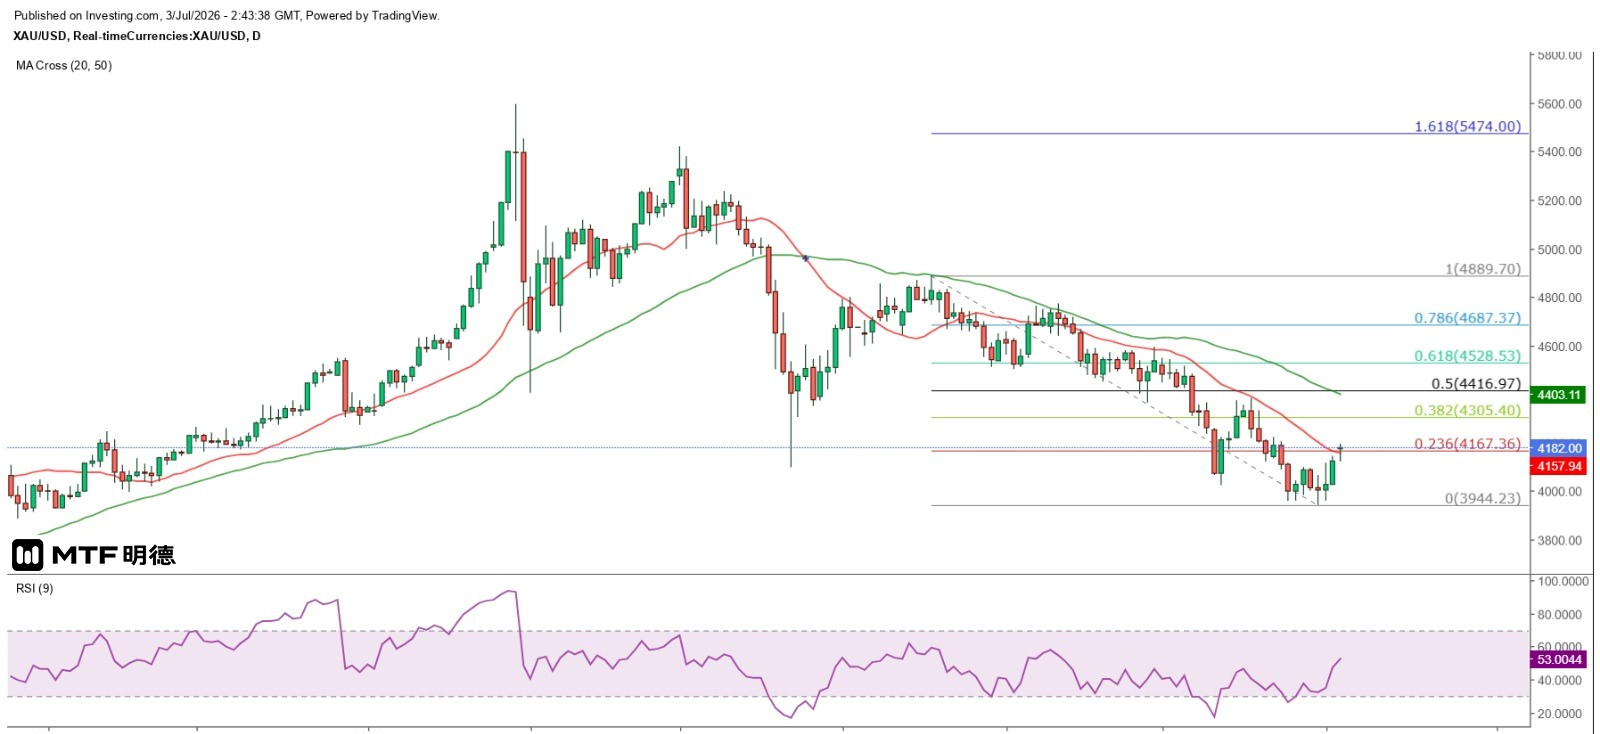
Gold Prices at a Critical Juncture March 7, 2026, 10:43 AM The U.S. added only 57,000 nonfarm jobs in June, far below the expected 114,000. The May job gain was also significantly revised downward from an initial reading of 172,000 to 129,000. The unemployment rate fell to 4.2% from 4.3%, while average hourly earnings rose 3.5% year-on-year, up from 3.4%. Leisure and hospitality lost 61,000 jobs, reflecting weaker-than-expected seasonal hiring compared to last year. The joint 2026 World Cup hosted by the U.S., Mexico, and Canada failed to stimulate a substantial surge in employment as anticipated. Other sectors, including professional and business services, social assistance, and healthcare, added 36,000, 25,000, and 22,000 jobs respectively. Overall, the labor market performance remained lackluster. Moreover, the U.S. labor market continues to show structural slowdown, with lingering effects from post-pandemic overhiring, the impact of AI on employment, and ongoing demographic aging contributing to a drop in the labor force participation rate to 61.5% in June—the lowest since March 2021. Tightening immigration policies have also reduced labor supply. Additionally, high inflation, elevated interest rates, and geopolitical instability have made companies more cautious about hiring. The decline in the unemployment rate to 4.2% is primarily due to more people exiting the labor market rather than significant improvements in employment conditions. Data has cooled market expectations for a Federal Reserve rate hike in the second half of the year, causing the dollar to sharply decline and gold prices to surge. Spot gold jumped from around $4,060 to $4,144 before slightly retreating, but clearly held above $4,100. In early Asian trading today, it further advanced, reaching a high of $4,195.56. Since June 30, the cumulative rebound has already surpassed 50% of the largest drop recorded since June 18. The gold price is currently at a critical juncture, with $4,210 located at the 180-degree angle of Gann's Square. The 61.8% retracement level from the aforementioned maximum decline stands at $4,214.71, suggesting strong resistance is expected as prices approach $4,210. Additionally, on the daily chart, gold has now broken above the 20SMA (currently around $4,157.7). A close above this level would mark the first such occurrence since May 14. If gold manages to close above the 20SMA for three consecutive trading days, a short-term rebound could unfold, with the next potential target or resistance level being the daily 50SMA (currently around $4,403). This short-term rally may extend into early next week. The above information is for reference only and does not constitute investment advice.
2026-07-02
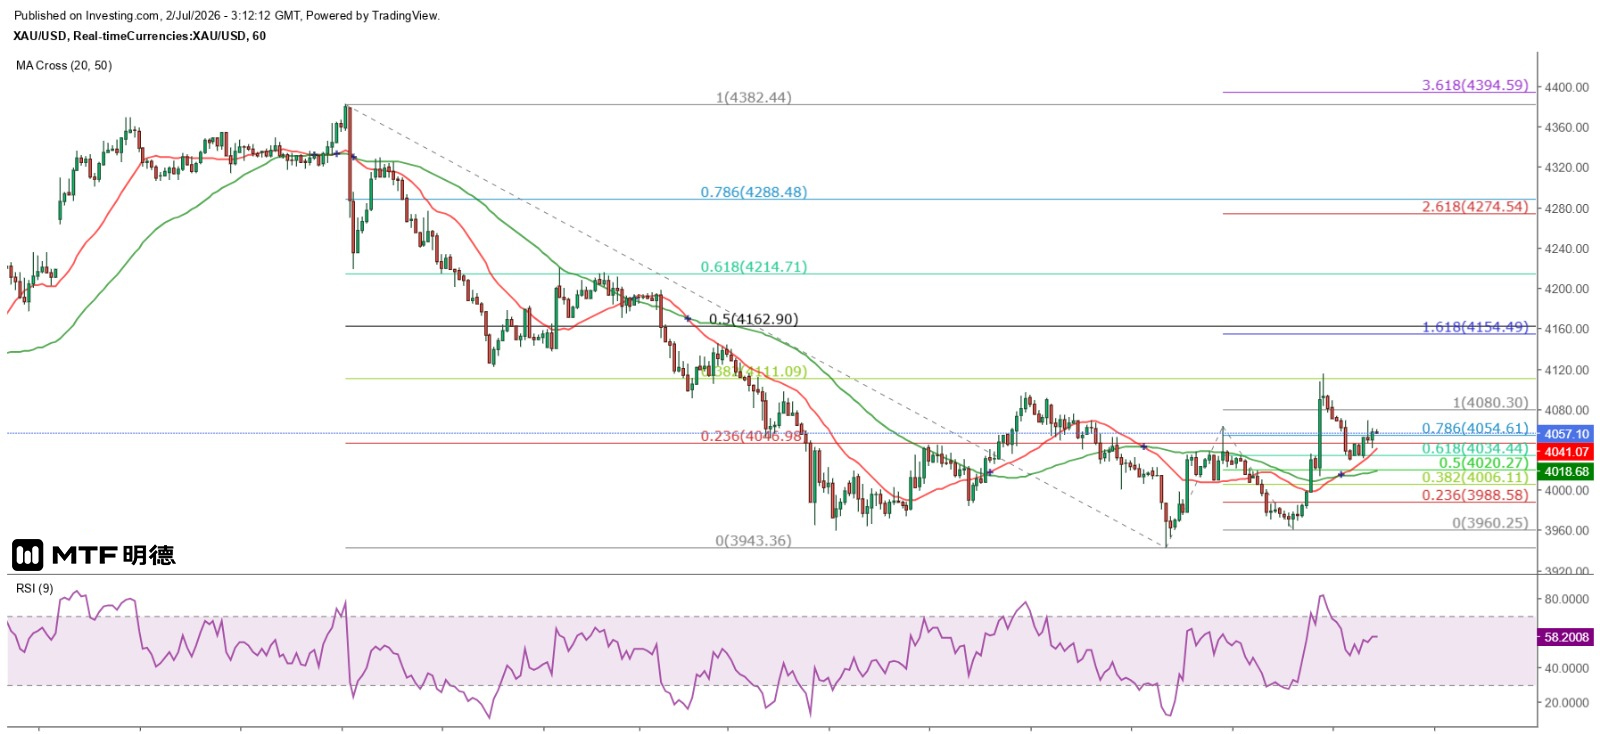
Gold price temporarily capped at $4,160 February 7, 2026, 11:11 AM Friday marks the U.S. Independence Day holiday, and U.S. financial markets will be closed tomorrow. As a result, the originally scheduled June non-farm payroll report for this Friday has been moved forward to tomorrow. Yesterday's ADP employment data showed that private-sector jobs in the U.S. increased by 98,000 in June, below the expected 118,000 and May's figure of 122,000. Following the release, spot gold briefly tested $4,013 but held firmly above the strong Gann square 90-degree angle support level at $4,010. Subsequently, prices surged on comments from Federal Reserve Chair Wash, reaching a high of $4,114.86 before retreating, encountering resistance near the 135-degree angle at around $4,110. Wash said inflation expectations and risks have declined in recent weeks, reiterating the Fed's commitment to bringing inflation down to its 2% target. He emphasized that those who believe the central bank will tolerate inflation above 2% would be disappointed, as authorities will ensure price stability. He also expressed his personal hope for a smaller Fed balance sheet. Although he refrained from using the dot plot to signal interest rate direction, he indicated it would remain in place for the near term. Due to the disappointing June employment data released by ADP, the market generally expects tonight's non-farm payroll figures from the Labor Department to also fall short of expectations, supporting a stronger gold price. On the hourly chart, after hitting a low of $3,943 on June 30, gold has been rallying repeatedly, although volatility has intensified. According to wave analysis, gold is likely in the third wave, with an immediate upside target at $4,155—very close to the 50% retracement level of the largest decline since June 18, which stands at $4,162.9. Therefore, this level can be considered the key short-term resistance. However, it should be noted that if the non-farm data comes in strong, gold could sharply decline, potentially finding a bottom only next Monday before rebounding, increasing the risk of another drop below $4,000. The above information is for reference only and does not constitute investment advice.
2026-06-30
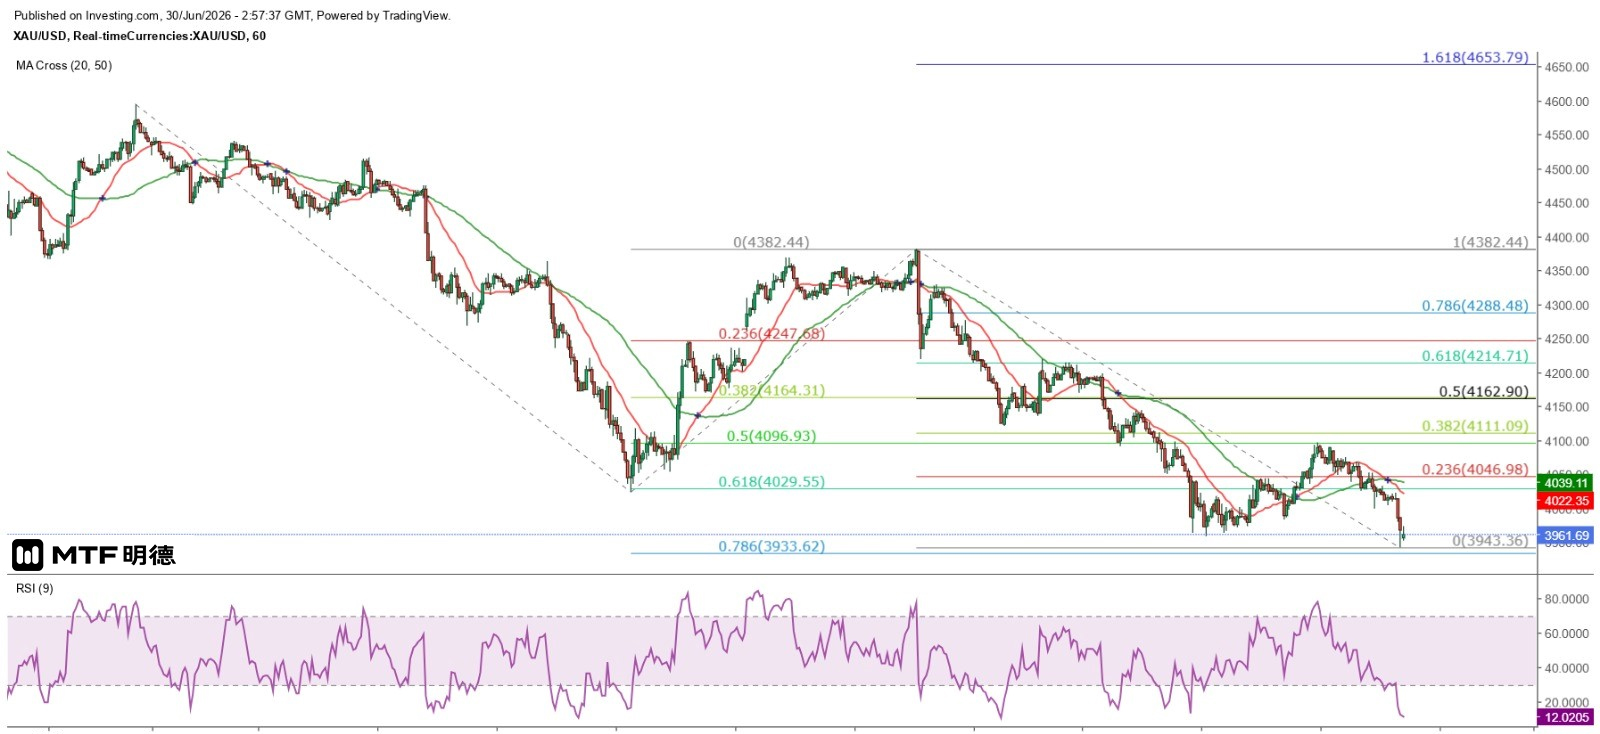
Gold prices may rebound as the yen surges 30/6/2026 10:55 Completed Last Friday's gold price rebound failed to reach even $4,100, coming in weaker than expected, leading to continued declines. Originally anticipated to briefly peak and then fall today, gold is now more likely to hit a short-term bottom and recover. This morning, gold prices plunged sharply during early Asian trading, with spot gold dropping from $4,015 to $3,943 before slightly recovering. The sudden drop was unrelated to U.S.-Iran talks but instead triggered by a sharp rise in the dollar against the yen, which broke through key resistance at 162, peaking at 162.39—the lowest level in 40 years—dragging down gold prices. Japan's Finance Minister, Katsuya Takahashi, stated that Japan reaffirms its readiness to respond appropriately to market movements and stands prepared to take necessary actions when needed, though she declined to comment on specific yen exchange rate levels. This signals the Bank of Japan's willingness to intervene in the currency market to stem the yen's decline, potentially at the opening of European markets today, the close of New York trading, or at the start of Tokyo trading tomorrow. A sharp rise in the yen due to central bank intervention could also drive gold prices significantly higher. Although gold prices have fallen below the strong Gann square 90-degree support at $4,010 and the psychological level of $4,000, the price has shifted from an expected top followed by a decline to a rebound after touching resistance. On the hourly chart, the RSI has dropped to 11, suggesting a potential double-bottom formation with the June 25 low. Meanwhile, on the daily chart, the price remains in divergence with the RSI, indicating limited downside risk at current levels. On the other hand, investors should note that the U.S. non-farm employment report for June will be released earlier than usual this Thursday. The market may use this as an opportunity to pressure gold prices downward before the data release, then trigger a sharp rebound based on the employment figures. Therefore, even if gold fails to recover quickly in the short term, it is likely to remain range-bound at lower levels with sideways fluctuations. The above content is for reference only and does not constitute investment advice.
2026-06-29
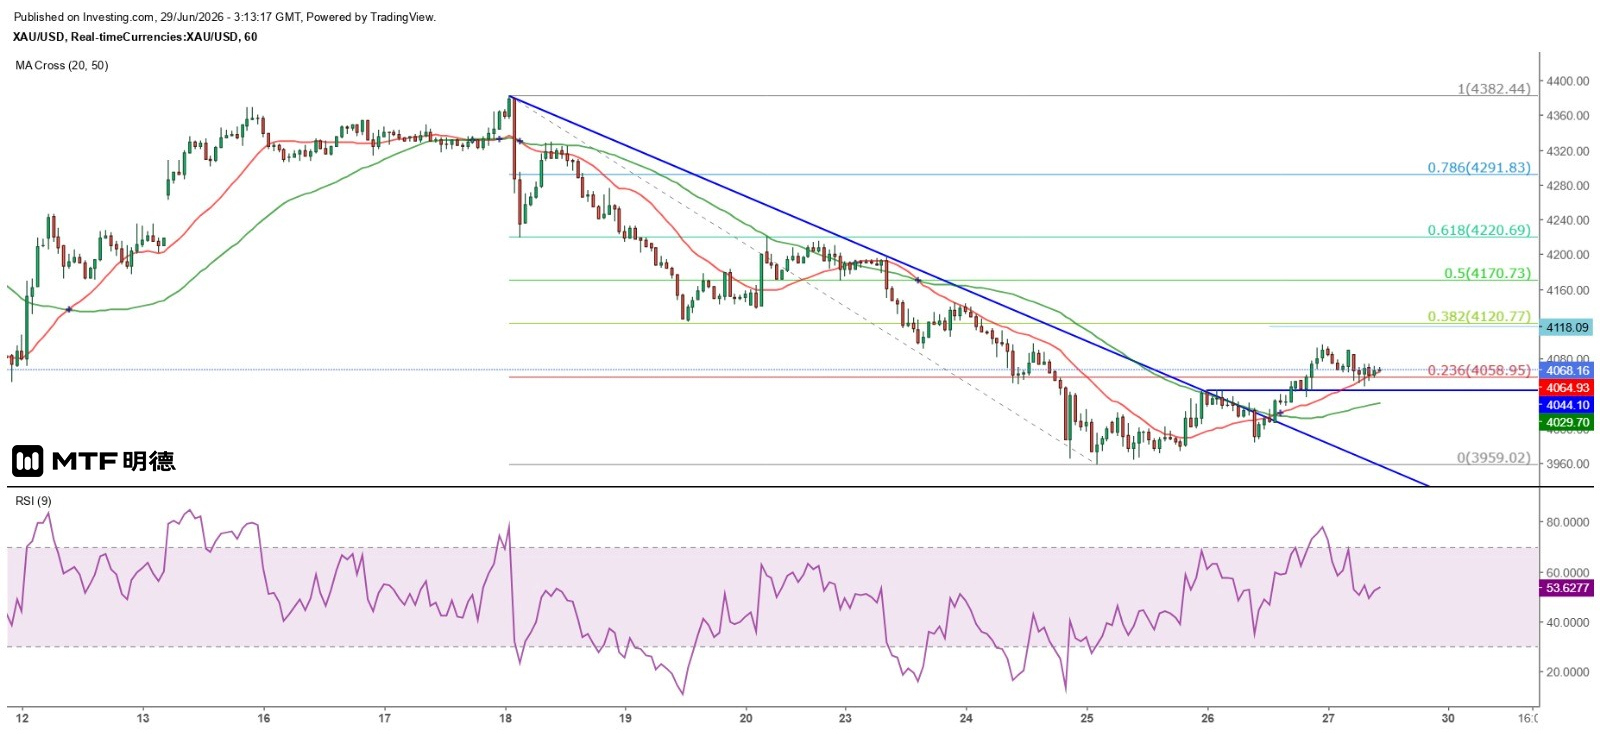
Gold price briefly held below $4,110 June 29, 2026, 11:12 AM Although renewed tensions between the U.S. and Iran initially triggered a gap-up in crude oil prices during early Asian trading today, prices failed to break above $71 and soon retreated to hover around the $70 level. Gold prices did not experience a sharp decline as a result, maintaining their upward trend since June 24. The latest conflict stems from Iran's claim that the U.S.-Iran agreement granted it sole jurisdiction over the Strait of Hormuz; however, with ships now rerouting through Omani waters, Iran feels deprived of potential benefits. As a result, Iran recently attacked a vessel attempting to transit the strait along the Omani coast. Currently, both sides have announced a temporary halt to hostilities and are returning to the negotiating table. The United States stated that both parties will temporarily cease fire, allowing free passage for vessels while technical talks continue. Although gold prices initially plunged sharply in early Asian trading on Friday, dipping as low as $3,983.32, they steadily recovered and rose to a high of $4,096.06 ahead of the London close. However, after briefly testing the $4,100 level again at the end of New York trading, prices pulled back. On the hourly chart, gold broke above the descending trendline resistance formed since June 18, and also surpassed both the 20SMA (currently around $4,065) and the 50SMA (currently around $4,029). Nevertheless, the total rebound has not yet reached the 38.2% retracement level of the downward wave that began on June 18. Currently, it is expected that gold prices will face resistance near the 38.2% retracement level at $4,120.77, which is extremely close to the June 19 low of $4,121.86. Additionally, $4,110 lies at the 135-degree angle of Gann's square, forming a secondary resistance. Therefore, the previous peak at $4,044 is still likely to provide support, and after a brief consolidation, gold prices are expected to test the $4,210 level at the 180-degree angle. The fact that gold has shown no reaction to renewed military tensions between the U.S. and Iran indicates that the key driver for gold has shifted toward interest rate trends, rather than lingering concerns over the Strait of Hormuz passage. The above content is for reference only and does not constitute investment advice.
2026-06-26
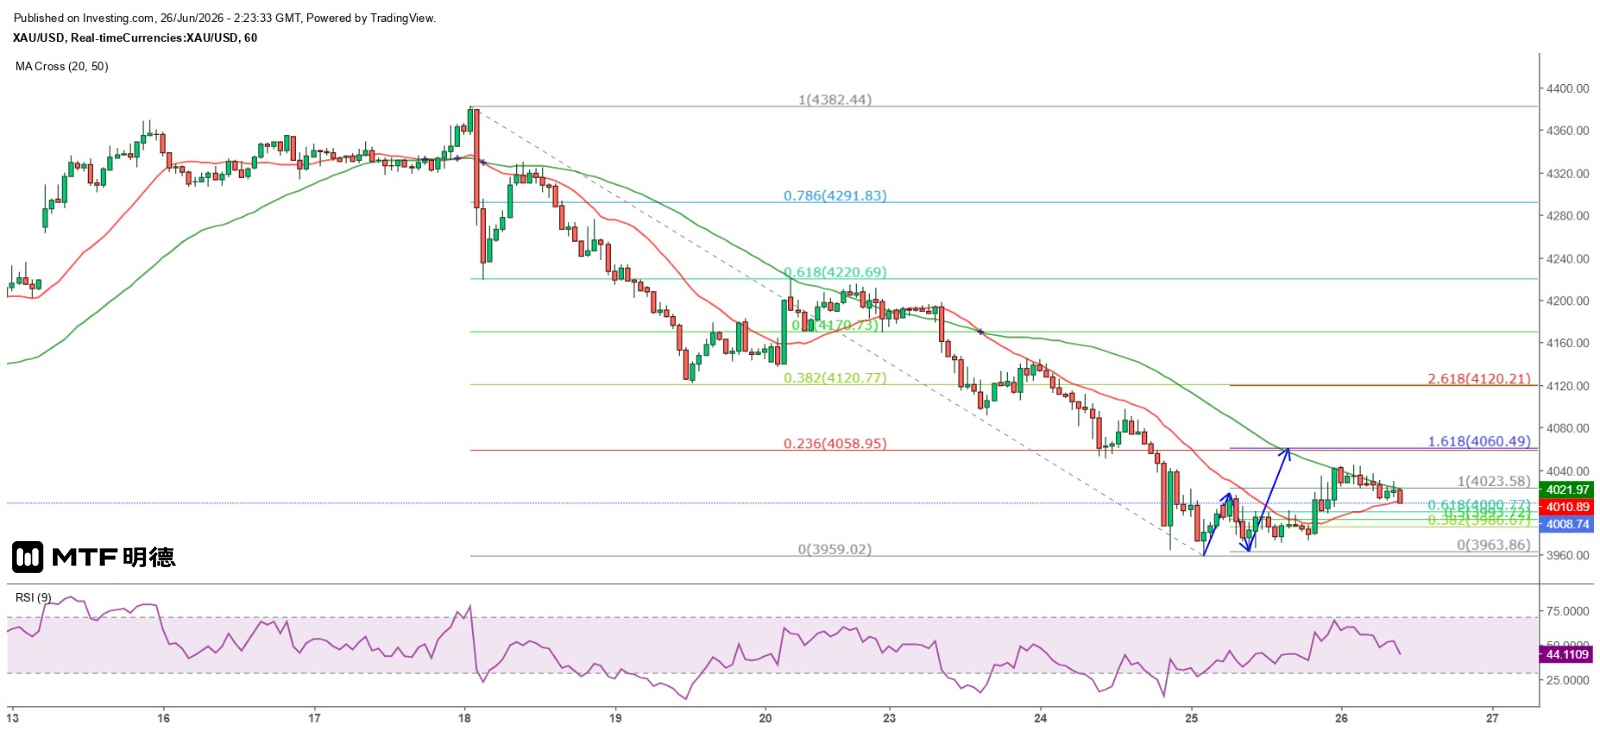
Gold price rebound continues, seen at $4,220 June 26, 2026, 10:23 AM Yesterday, the U.S. released May PCE data, with core PCE rising 3.4% year-on-year and 0.3% month-on-month—both in line with expectations. Overall PCE increased 4.1% year-on-year, matching forecasts but higher than April's 3.8%, while the monthly rise of 0.4% matched April's level but fell short of the expected 0.5%. The data suggests the Federal Reserve is likely to maintain current interest rates, even if it does not raise them. Additionally, the U.S. released the final GDP figure for the first quarter of this year, showing a seasonally adjusted annual rate increase of 2.1%, significantly above the expected 1.6%. According to detailed data released by the U.S. Bureau of Economic Analysis, the strong GDP growth in the first quarter was primarily driven by substantial increases in private investment and federal government spending, which rose 7.9% and 4.4% quarter-on-quarter respectively (compared to increases of 2.3% and a decline of 5.6% in the fourth quarter of last year). In contrast, personal consumption expenditures slowed markedly from 1.9% to 0.5%. In private investment, the AI industry has clearly emerged as a major driver of economic growth, with spending rising 13.8% (compared to 5.4% in the fourth quarter of last year), while equipment investment also surged by 15.8% (up from 4.3% in the fourth quarter of last year). However, the U.S. took military action against Iran in April, and the impact of this will be reflected in second-quarter GDP. Gold prices have largely moved in line with expectations. Yesterday, spot gold indeed did not fall below Wednesday's low and surged sharply following the release of U.S. PCE data that met market forecasts, peaking at $4,044.31 during New York midday trading before gradually retreating. On the hourly chart, gold has been declining closely along the 50SMA (currently around $4,036) since yesterday's high, forming a rising flag pattern suggesting a potential breakout higher. There is a very high probability that gold will rise to the $4,060 level today. Investors may further use Fibonacci extension levels based on the trend since June 18 to project short-term price targets: a 38.2% rebound from the recent decline could bring gold to $4,120.77; a 50% rebound to $4,170.73; and a 61.8% rebound to $4,220.69. From the Gann Square perspective, $4,110 and $4,210 are positioned at 135-degree and 180-degree angles respectively, with $4,210 offering relatively stronger resistance. Therefore, it is temporarily inferred that gold prices may rebound to approximately 61.8% of the previous maximum decline, reaching $4,220.69, before encountering significant resistance. If gold rebounds only to around $4,120.77 and then faces strong resistance followed by a sharp pullback, this would indicate weak upward momentum, increasing the likelihood of further lows in the near future. The above content is for reference only and does not constitute investment advice.


