
 en-US
en-US 

 Telegram
 WeChat

2026-03-18
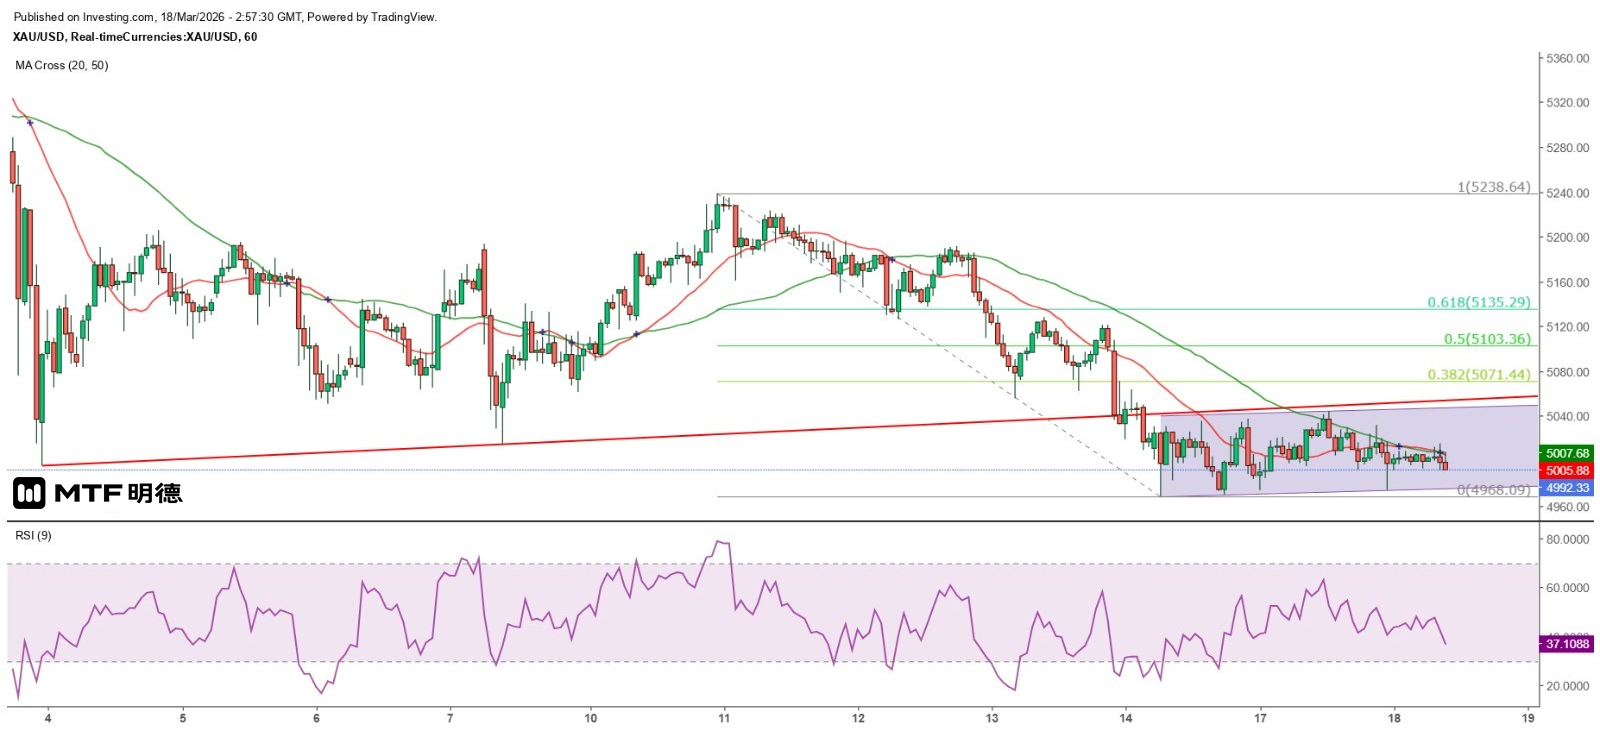
"Gold Price at $4,960 Is the Last Line of Defense" 18/3/2026 10:53 Finalized The war between the US, Israel and Iran remains deadlocked, with no breakthrough in sight. This has led to the continuation of the inverse relationship between oil prices and gold prices. New York crude oil has temporarily encountered resistance at $100 per barrel, while the spot gold price is hovering around $5,000. If this inverse relationship persists and oil prices rise above $100 per barrel again due to the shortage of crude oil supply from various countries, gold prices should fall even further. However, as Iran has blocked the vital Strait of Hormuz, a major oil shipping route, no oil will flow out even if oil prices soar to $200 per barrel, thus the shortage problem will not be solved. Of course, many countries have reached agreements with Iran to ensure the safe passage of oil tankers through the Strait of Hormuz, and oil-exporting countries can also make a fortune by selling their future crude oil in the futures market. Yesterday, the spot gold price plunged to $4,973.92 in the last hour before the London market closed. It then gradually rebounded but failed to close above $5,000 on the hourly chart. As of the early Asian session today, the spot gold price is still hovering around the $5,000 mark. Yesterday's sharp drop seems to be setting the stage for further declines in the coming days. The Federal Reserve will announce its interest rate decision tonight (at 2 a.m. Thursday). It is expected to keep rates unchanged. The market's focus will be on how the current US-Israel-Iran situation will affect US inflation. It is easy to imagine that the Fed must be concerned that persistently high oil prices could push up US inflation. Coupled with the fact that the job market is performing worse than expected, the combination of these factors could push the US into a recession, which in turn would affect global economic performance. This would increase expectations of future rate cuts and a weakening economy would reduce crude oil demand, causing oil prices to fall. Therefore, the short-term situation of oil rising and gold falling may persist, but it won't last long. Currently, what investors need to pay attention to is whether the gold price will drop sharply once the Federal Reserve announces that the interest rate remains unchanged tonight, especially whether it can quickly return above 5000 US dollars after breaking through this level, and whether the gold price will close below the 50SMA on the daily chart (currently about 4977) for two consecutive trading days. If so, it will be unfavorable for the gold price. In addition, the SPDR holdings have gradually decreased from 1101.33 tons on March 2nd to 1069.56 tons yesterday, reflecting the continuous pressure on the gold price during the US-Iran-Iraq conflict. The gold price has still not been able to shake off the selling pressure at 5000 US dollars recently, and the possibility of a break within the day has increased. However, 4960 US dollars is still regarded as a strong support level, but the lower limit of the short-term fluctuation range may shift down to 4960 US dollars, while 5060 US dollars remains the main resistance. The above content is for reference only and does not constitute investment advice.
2026-03-17
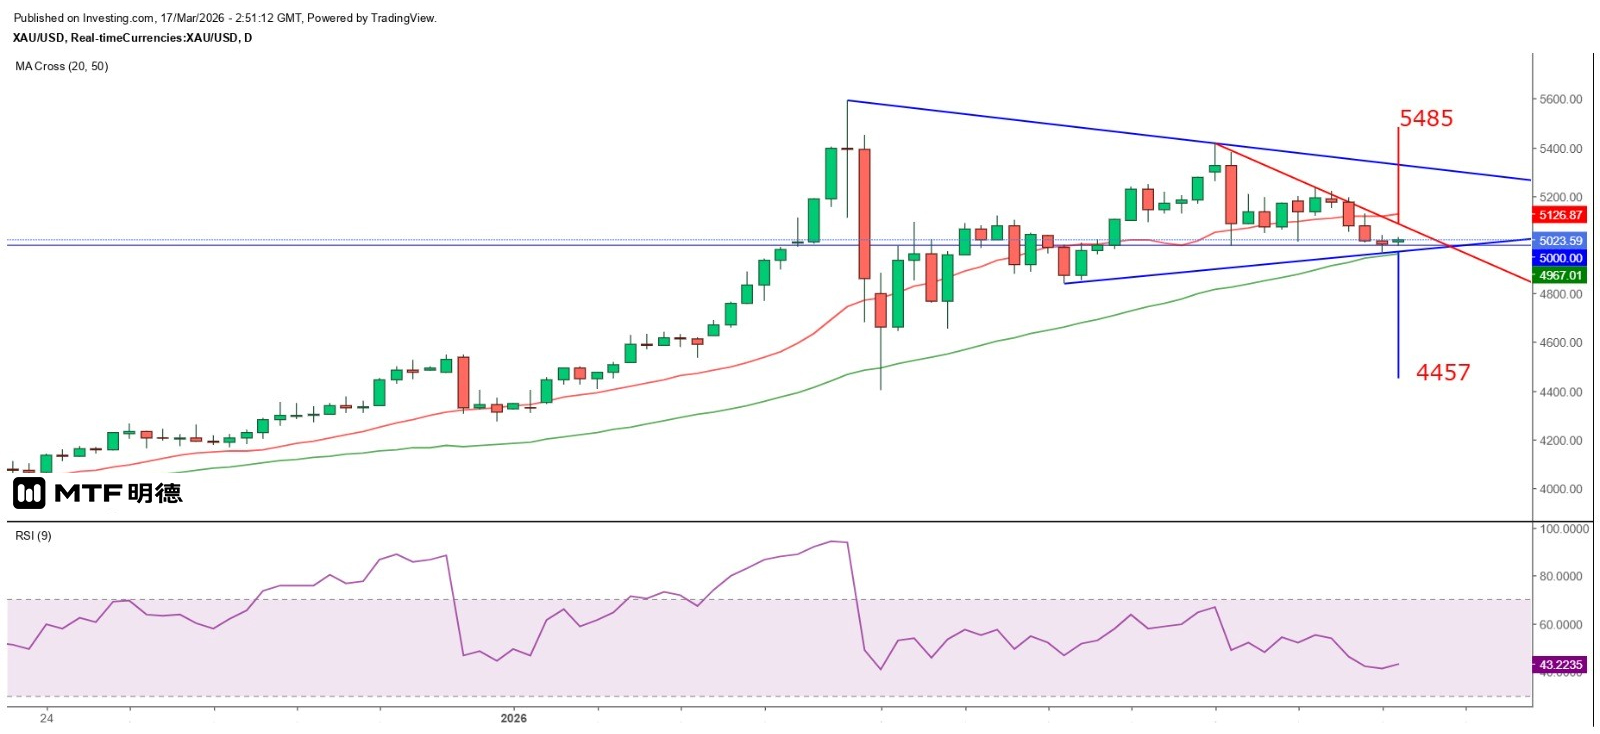
"Gold Price at $5,000 Becomes a Strong Support Again" 17/3/2026 10:48 Finalized Yesterday, the gold price continued to be pressured at the $5,000 mark. The spot gold price attempted to break through $5,000 in the early Asian session, the early European afternoon session, and at the close of the London market. However, the low of $4,968.09 made in the Asian session was the lowest for the day, indicating that selling pressure gradually weakened in the European and New York sessions. After the gold price re-entered above $5,000 in the mid-New York session, it has not closed below that level on the hourly chart until the early Asian session today. The movement from yesterday to today has shown a sideways consolidation pattern, leading me to believe that it is a consolidation at the low level, preparing for the Federal Reserve's interest rate decision. From the daily chart, the 50SMA (currently around 4967) remains a significant support level. The gold price is still holding above this line, but if it were to break below it quickly and close below it for two consecutive days without a strong rebound from the bulls, it would suggest a further decline in the gold price. Currently, the gold price is in a narrowing triangle, indicating that the forces of the bulls and bears are getting closer to a decisive battle. A breakout in either direction will destroy the opposing side and attract more new participants. The extended resistance of the daily chart's downtrend line is approximately 5330 US dollars, and the measured target for an upward breakout is around 5485 US dollars, while the measured target for a downward breakout is approximately 4457 US dollars. From the Gann Square perspective, yesterday's low was close to the 90-degree angle at $4,960, which also confirmed that the gold price has strong support at this level. As the gold price has now re-stabilized above $5,000, this level will be regarded as an important support for the day. The expected resistance levels for the day's rise are $5,071.44 and $5,103.36, while the first major resistance at the 135-degree angle is $5,110. If it breaks through this level, it will turn from resistance to support, and the gold price is expected to further challenge the resistance at the 180-degree angle of $5,260. The above content is for reference only and does not constitute investment advice.
2026-03-16
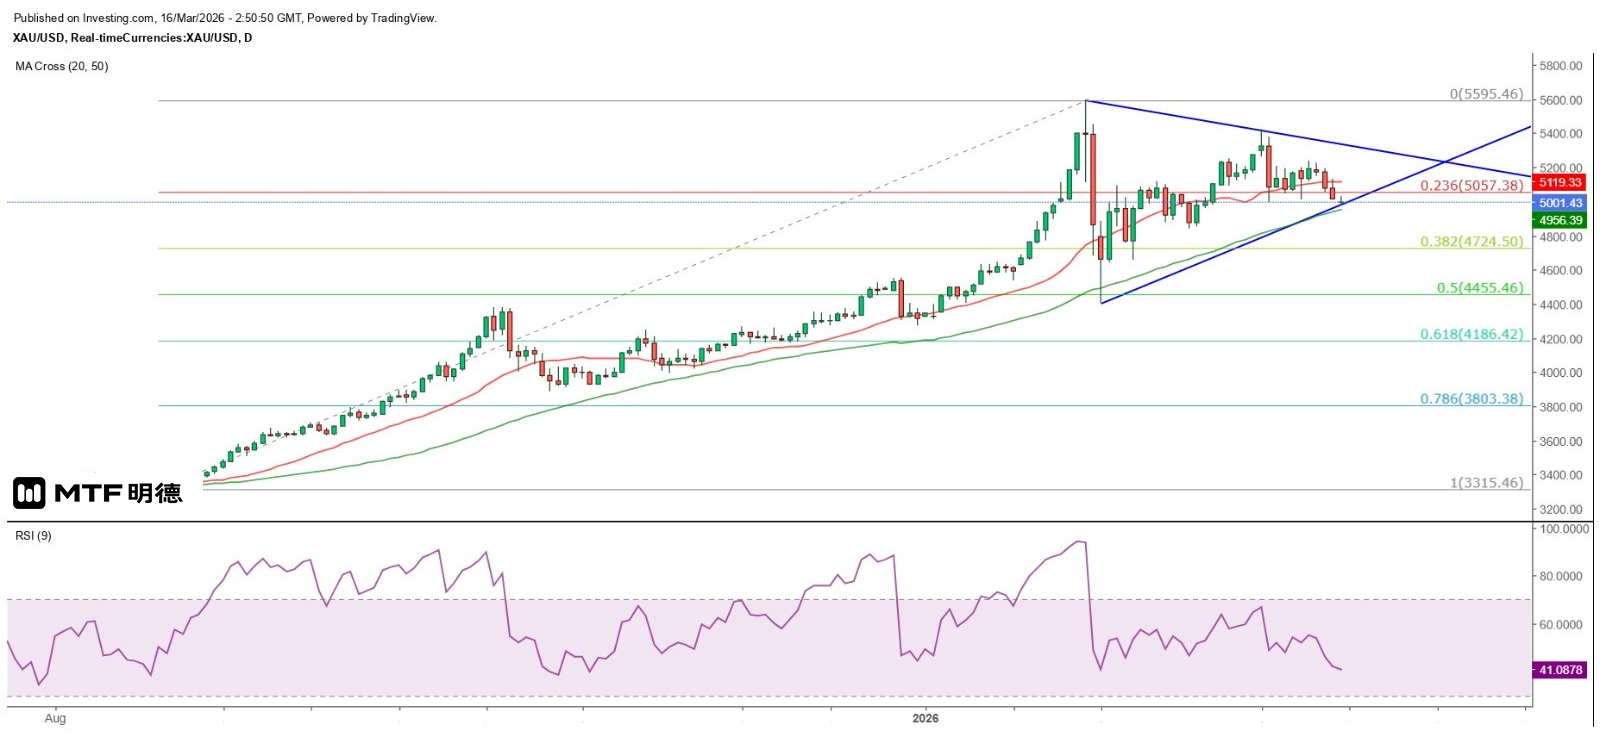
"Gold Prices Hold Steady Above 50-Day Moving Average, No Sign of a Decline Yet" 16/3/2026 10:46 Finalized After the US military bombed Kharg Island, a vital artery for Iran's oil exports, US President Trump called on China, Japan, South Korea, the UK and France to join the US in escorting ships through the Strait of Hormuz. Later, he posted on his social media Truth Social, saying that many countries, especially those affected by Iran's attempt to close the Strait of Hormuz, will cooperate with the US and send warships to ensure the strait remains open and safe. It is believed that the remarks were the cause of the sharp drop in gold prices in the early trading session in Asia this morning and the high opening and low closing of international oil prices. The spot gold price hit a low of $4,968.09 this morning, then rebounded to $5,030.87. However, it was blocked at $5,030 and fell again, but the low was only $4,982.87. It rose rapidly in the hourly chart and closed at the upper limit of the range. It is temporarily stable in a narrow range above $5,010. From the daily chart, the low of gold price this morning is less than 10 dollars away from the 50SMA (currently around 4956.6), indicating a high probability of a rebound. The reason is that since gold broke through the 50SMA on May 22 last year, it has never closed below this line (it briefly touched the line on February 2 this year but closed above it on the same day). Moreover, the military conflict between the US and Iran (or the US, Israel and Iran) only has a direct impact on oil prices, and gold is not the main player. Unless the gold price closes below the 50SMA on the daily chart and fails to quickly recover above it, it is not advisable to rashly conclude that the 50SMA will be broken and that the price will fall further! There is heavy selling pressure above $5,100. From the hourly chart, as the low point this morning has fallen below the low point on March 3rd, the previous judgment of waves 2 and 3 is invalid. Even so, the possibility of a short-term bottoming out and rebound in gold prices remains very high. Don't forget that the low point this morning at $4,968.09 is extremely close to the Gann 90-degree level at $4,960. Moreover, after breaking through $5,130 last Thursday, the price reached $5,128.39 and $5,121.71 respectively on Friday, indicating that the pressure at $5,130 is still significant. Meanwhile, $5,110 is located at the Gann 133.5-degree angle, which is a secondary resistance (or support) level. In the short term, $5,000 is indeed a significant psychological support level, while the 50-day simple moving average (SMA) on the daily chart serves as a crucial technical support. Given that the Federal Reserve will announce its interest rate decision at 2:00 AM this Thursday, and the Bank of Japan, the Bank of England, and the Swiss National Bank will also release their interest rate decisions on Friday, it is expected that these events will cause short-term fluctuations in gold prices. However, it is not advisable to be overly pessimistic before the price clearly breaks below the 50-day SMA. It is anticipated that gold prices will fluctuate within the range of $5,000 to $5,110 in the short term. The above content is for reference only and does not constitute investment advice.
2026-03-13
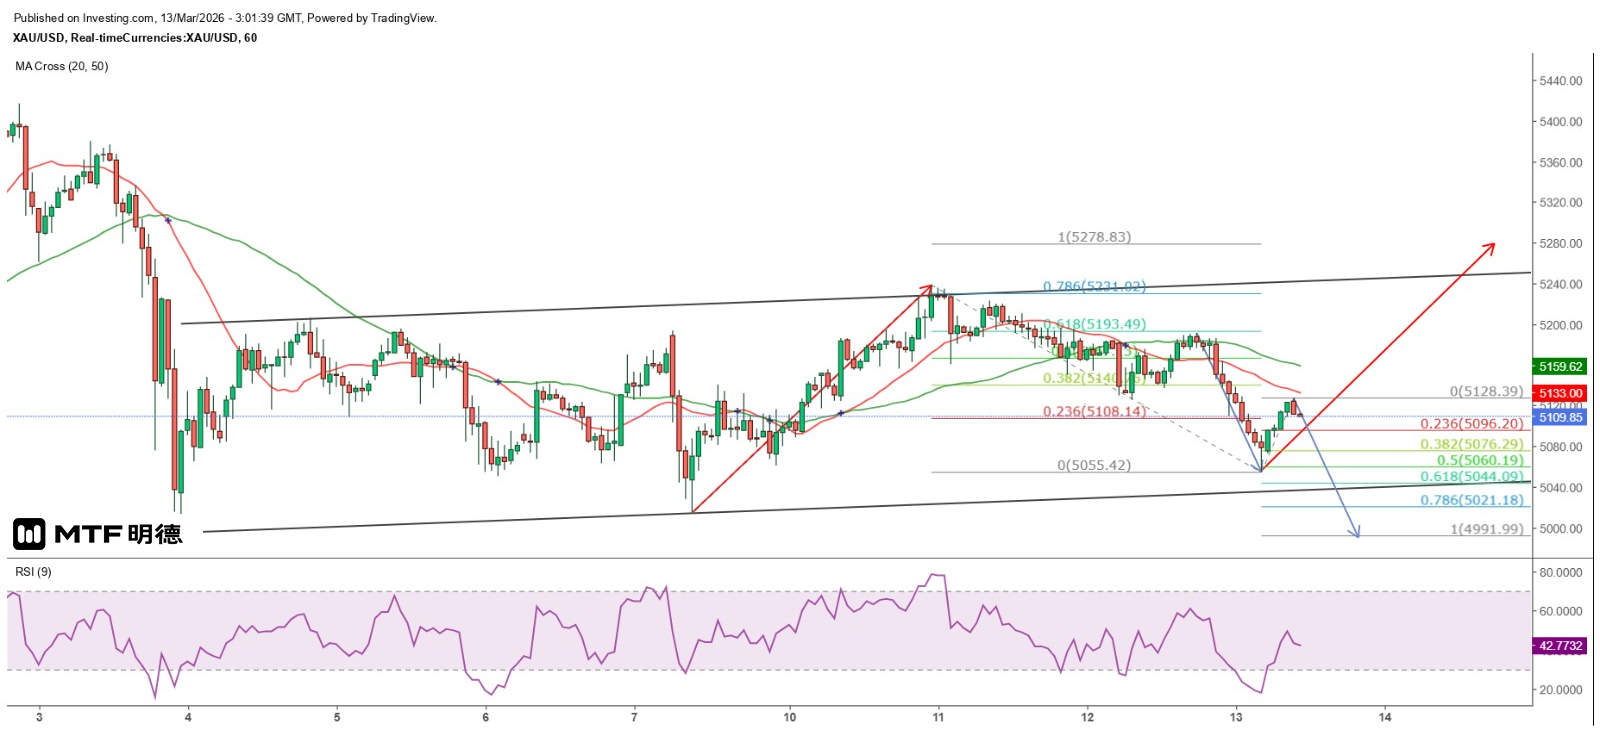
"Gold prices are likely to bottom out and rebound today." 13/3/2026 10:50 Completed. Yesterday, the gold price exhibited three distinct patterns. In the Asian morning session, it fluctuated in a triangular pattern. During the European morning session, it moved sideways, reaching a high of $5,191.82. However, in the New York session, it entered a one-sided decline, falling to the day's low of $5,055.42 at the end of the session, reflecting significant differences in investors' views on gold prices across different regions. Today, in the early Asian session, the gold price rose to $5,128.39, approaching yesterday's Asian session low of $5,126.13, which is a typical situation where a support level, once breached, becomes a resistance level for a rebound. However, from the hourly chart, it can be seen that the gold price is still within a large balanced ascending channel. It was pointed out yesterday that today is a turning point for the gold price. Considering the current relatively low price, the possibility of a bottom is higher. But the final judgment should be based on the closing price. If the gold price rises significantly during the day and challenges yesterday's high, or even reaches the top of the ascending channel, it should be judged as a top. Unless there is a significant breakthrough of the top of the ascending channel, it is not advisable to chase the high rashly. Furthermore, if the early rebound high of today becomes the intraday top of gold price and it further drops, the Fibonacci extension can be used to find the potential support level of the gold price. Taking the high of yesterday's European session at $5,191.82 to the low of yesterday's New York session at $5,055.42 as the first round of decline, if a new decline wave starts now, and the extent is equivalent to 100% of the above-mentioned decline, then the gold price will fall to $4,991.99; 61.8% will be at $5,044.09, and 50% will be at $5,056.19. Among the above-mentioned prices, the 61.8% decline target is the closest to the bottom of the ascending channel. As the gold price is expected to remain above $5,000 and still be within the balanced ascending channel, the 61.8% adjustment level can be regarded as an ideal entry point. The above content is for reference only and does not constitute investment advice.
2026-03-12
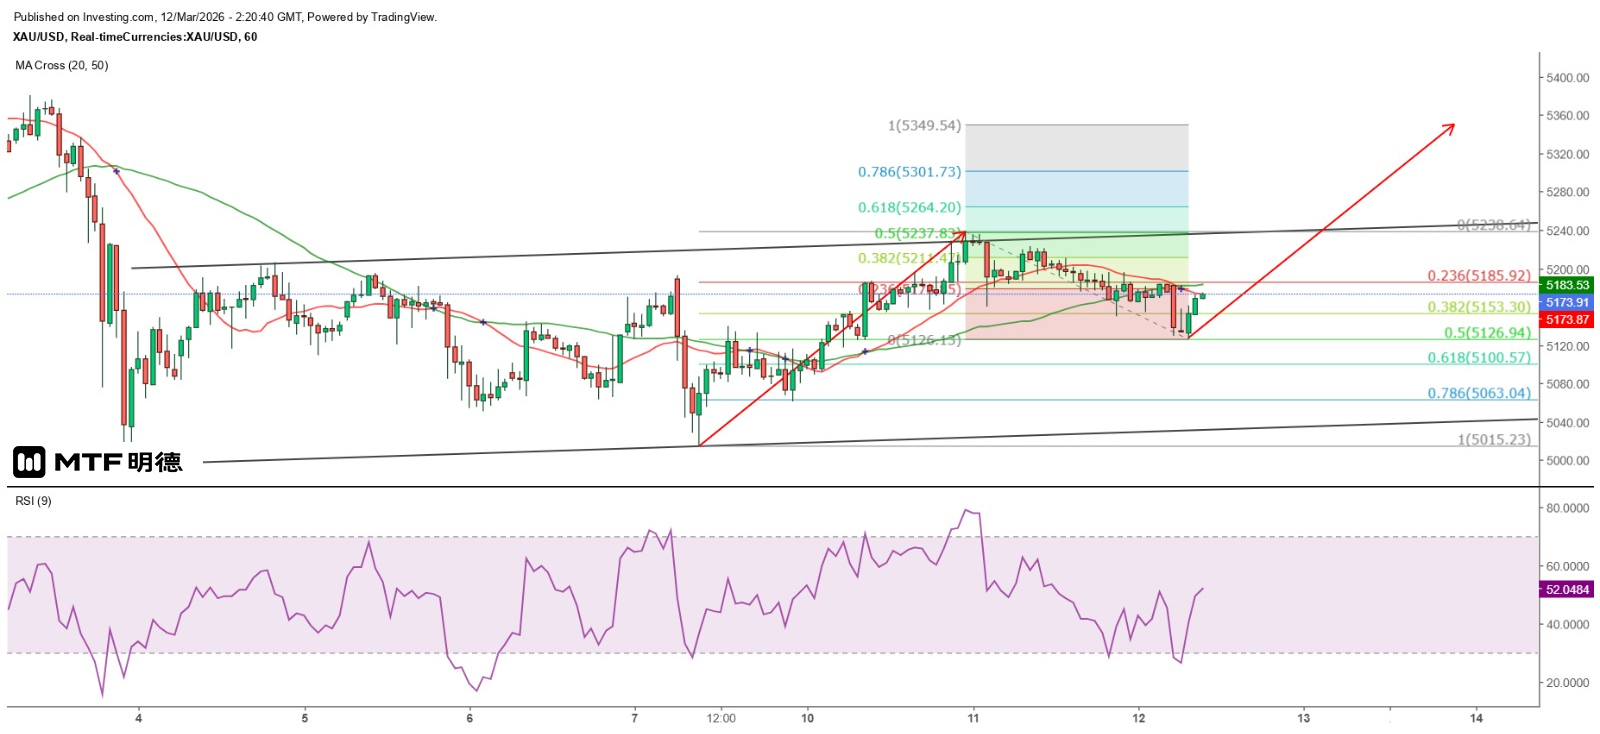
Gold prices are expected to rise in anticipation of the interest rate decision next week. 12/3/2026 10:19 Finalized Gold prices have remained in a volatile pattern. From the hourly chart, the spot gold price has gradually formed a balanced upward channel since March 3rd, ranging approximately between 5030 and 5235 US dollars, which is within the two support or resistance levels of the Gann Square - 4960 to 5260 US dollars. The spot gold price dropped sharply at the beginning of the Asian market today, reaching a low of 5126.13 US dollars. It then rebounded but was temporarily constrained by the 20SMA on the hourly chart (5173.6). It should be noted that the low point this morning precisely coincides with the 50% retracement level of the biggest increase since September 9th, which is $5,216.94. If the gold price can remain above this level, it is almost certain that it will rise sharply tomorrow and form a recent peak. However, if the gold price continues to fluctuate as it has recently, the possibility of a sharp rise followed by a fall is relatively high. Nevertheless, what investors should pay attention to is whether the gold price can make a major breakthrough and continue to rise, especially as the Federal Reserve will hold a monetary policy meeting next Tuesday. Even if the meeting statement reflects the authorities' concern that the sharp rise in oil prices will push up inflation, the authorities are more concerned about the deterioration of the job market. Therefore, the possibility of a rate cut in the first half of the year remains high. Using the Fibonacci extension to measure the movement since March 9th, if the amplitude reaches 100%, the gold price will rise to $5,349.54, which is extremely close to the 3-wave upward target of around $5,354 previously estimated by the wave theory. If the gold price rises above $5,350 in the short term, it is advisable to take the opportunity to lock in profits from good positions. The key support levels for the day are expected to be $5,127 and $5,100. The above content is for reference only and does not constitute investment advice.
2026-03-11
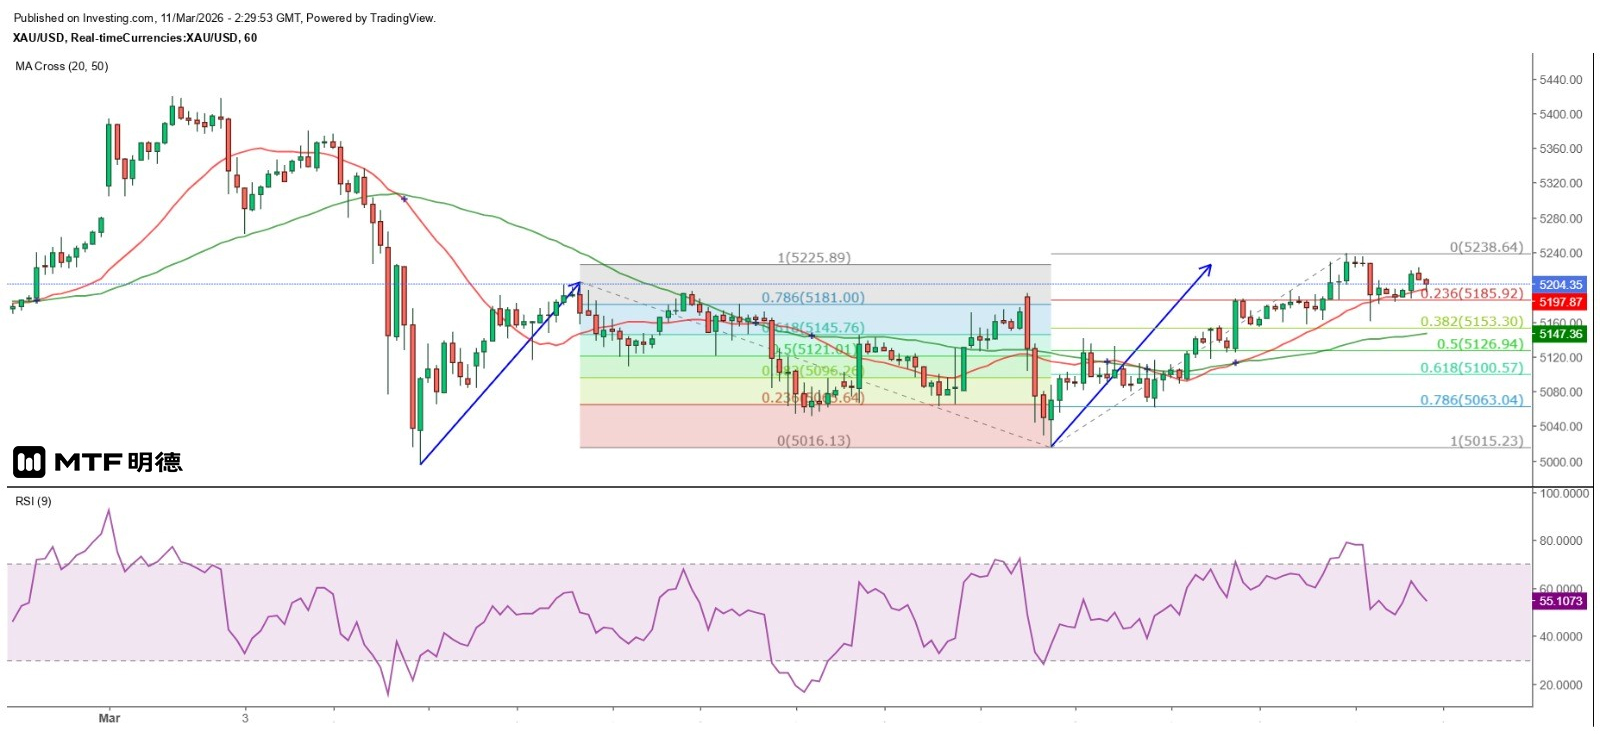
Gold price breaks through $5,200 with cautious optimism. 11/3/2026 10:29 Completed Gold price rose above $5,200 as expected. The spot gold price reached a high of $5,238.64 in the morning session of New York yesterday. Although it plunged to a low of $5,160.63 in the early afternoon session of New York, it gradually recovered. Therefore, it is believed that the decline was triggered by profit-taking. Although the spot gold price only reached a high of $5,223.1 in the early Asian session today, it still held above the 20SMA on the hourly chart (currently around $5,196). If it continues to stabilize above $5,200 and consolidate sideways, it will be regarded as a typical consolidation pattern after breaking through resistance. The market is likely to rise further in the future. Looking at the hourly chart again, yesterday's high approached the 100% Fibonacci extension level at $5,224.99, so the initial upward target has been reached. A short-term correction may occur. If the gold price clearly breaks below the 20SMA on the hourly chart, it is likely to test the 50SMA (currently around $5,147) before rebounding. The 38.2% retracement target of the largest increase since September 9 is at $5,153.3, which is close to the 50SMA. If the gold price rebounds strongly when it approaches this level, it indicates that the upward trend remains strong. Conversely, if the gold price breaks below the 50SMA or tests $5,126.94 and there is no strong counterattack from buyers, the possibility of testing $5,000 again increases. From the perspective of Gann's Square, the current gold price is still fluctuating within the range of $5,110 (weak support) to $5,260 (strong resistance). The 50% and 61.8% correction targets of the largest increase since September 9th are at $5,126.94 and $5,100.57 respectively. The support level of the Gann's Square mentioned above is precisely between the two. Investors should pay attention to whether there is strong support when the gold price drops to this level. From the short-term cyclical trend, this Friday will be a turning point for the gold price. If the price is at a high level on that day, such as $5,260, $5,310, or even higher, the probability of the gold price peaking on that day is very high. Conversely, if the gold price is clearly at a low level, such as $5,100, or even drops back to around $5,000, the probability of the gold price bottoming out on that day is very high. The above content is for reference only and does not constitute investment advice.
2026-03-10
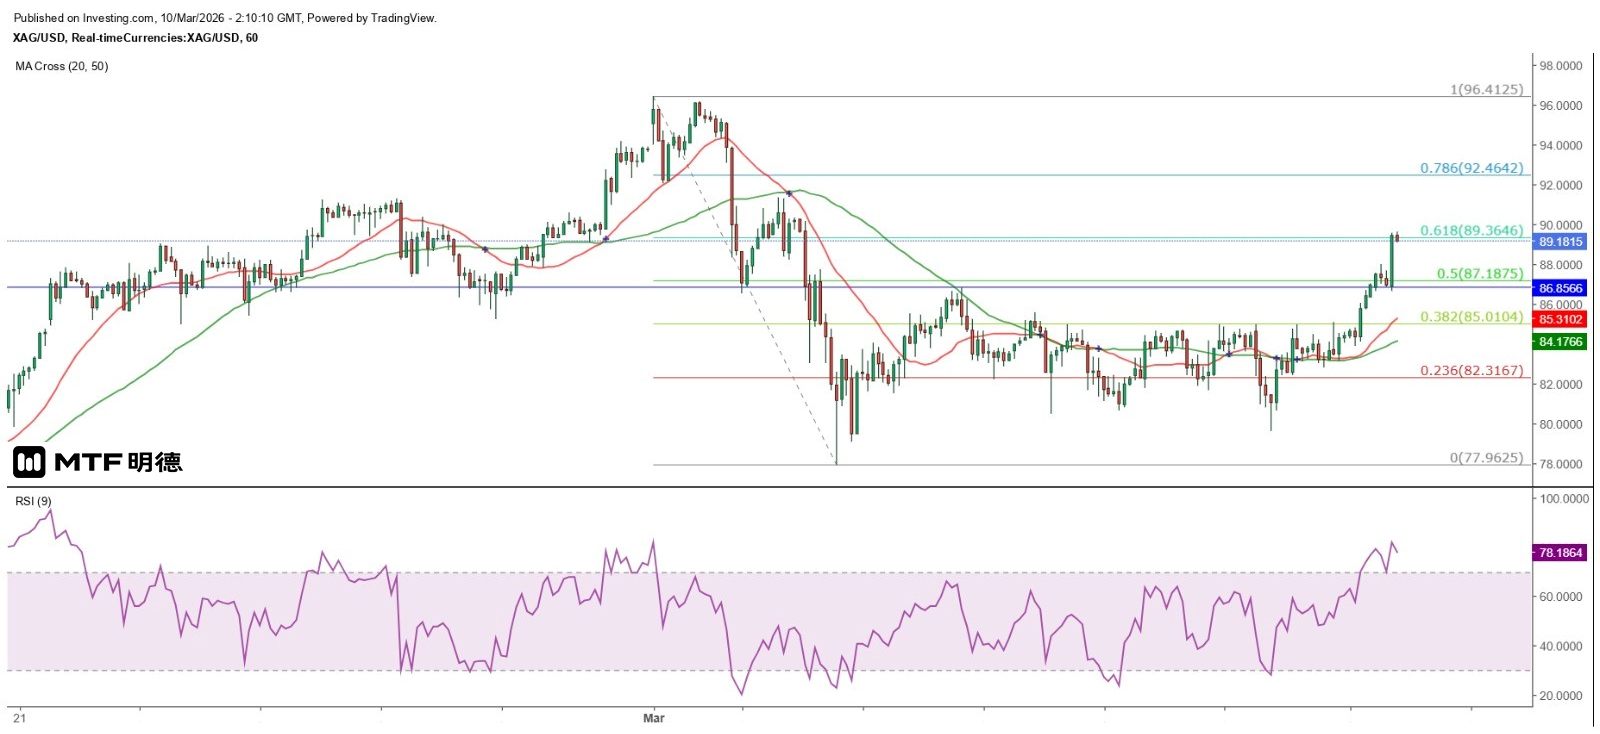
"Silver May Challenge $96" 10/3/2026 10:06 Completed Yesterday, the New York oil price soared by over 30%, but was brought down by a single statement from Trump. Trump claimed that the US military operation against Iran would soon end, causing the New York oil price to plunge to a low of $81.25 in the late New York trading session yesterday. Although it rebounded slightly afterwards, it was clearly constrained by the 9SMA on the hourly chart (currently around $89.46). This morning in the Asian trading session, it rebounded slightly to $90.23 but was then blocked and fell back. It is expected to be constrained by $90. Even if it briefly breaks through, it is unlikely to rise above the top of the large bearish candle formed in the late New York trading session yesterday, which was $95.58. Yesterday, it was observed that gold prices and oil prices were in an inverse relationship. The short-term outlook for oil prices suggests a further decline, which would allow gold prices to resume their upward trend. After hitting a low of $5,117.71 in the early Asian session today, the spot gold price closed with a long-tailed hammer on the hourly chart. After a period of consolidation, it rallied strongly and reached a new intraday high close to $5,169. The probability of it rising above $5,200 within the day is very high. If it breaks through the top of the sideways range formed since March 23, a simple measurement of the upward movement would suggest that the gold price could rise to $5,335. As mentioned yesterday, if we consider this as the third wave, the upward target would be $5,354.62. The ratio indicates that the performance of silver prices will outshine that of gold prices. The current gold-silver ratio has dropped below 60, with the lowest point reaching 43. A level of 50 can be regarded as a strong support since records began, meaning that when the ratio is below 50, the silver price outperforms the gold price. Observing the monthly chart, the gold-silver ratio has fallen from a peak of 107.27 in April last year to a low of 43.32 in January this year, approaching the maximum decline from March 2020 to February 2021 (the 100% extension of the decline target is 42.49), indicating that the silver price is likely to continue to rise. Therefore, it is possible that both gold and silver prices will rise, but the silver price will increase more; secondly, both gold and silver prices will fall, but the silver price will decline less; thirdly, the silver price will rise while the gold price will fall, which is less likely. From the daily chart, the gold price pattern all indicates a greater chance of a medium-term decline. From the hourly chart, the gold price is still within the sideways range, while the silver price has broken upward, confirming that the silver price outperforms the gold price. The silver price is expected to challenge $96 in the short term! The above content is for reference only and does not constitute investment advice.
2026-03-09
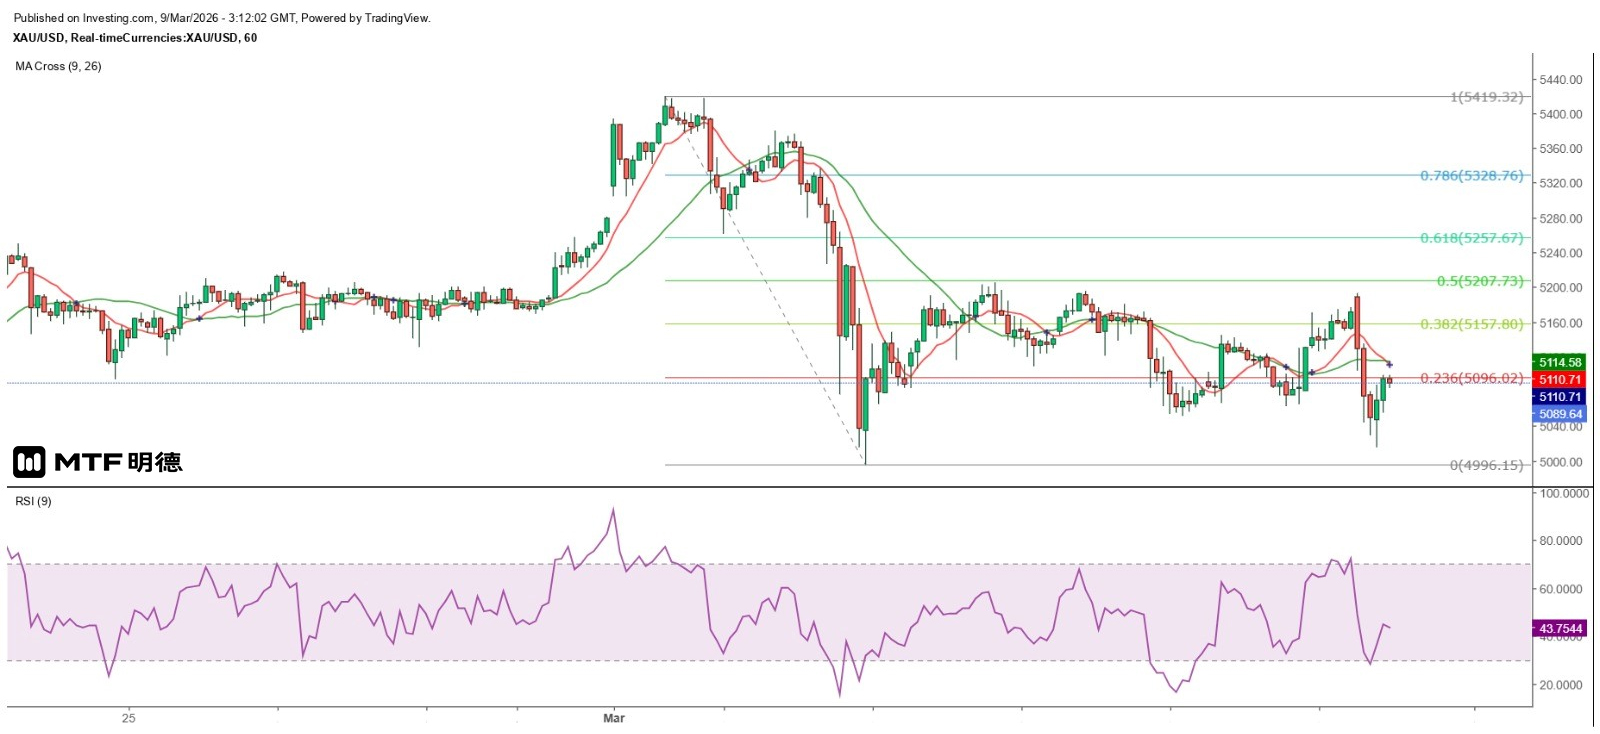
"Gold Prices Tend to Rise Repeatedly This Week" 9/3/2026 11:10 Completed The U.S. non-farm payroll report for February was much worse than expected, with a loss of 92,000 jobs and the unemployment rate rising by 0.1 percentage point to 4.4%. Additionally, retail sales in January fell by 0.2% month-on-month, which was not as bad as the expected 0.3% decline, but still worse than the previous month. The non-farm payroll data pushed gold prices to rise sharply. After the release of the data, the spot gold price rose rapidly to the $5,130 level, then gradually declined and even fell below the pre-release low to $5,074.72 before climbing again. Later, it fluctuated and rose in New York to $5,176.32. However, gold prices opened sharply higher in today's Asian session, rising to $5,193.21 before plummeting. It fluctuated and dropped to $5,015.23 before gradually rebounding. However, it was clearly blocked before $5,100. It should be noted that international oil prices rose sharply in today's Asian session. New York crude oil broke through $100 per barrel and continued to rise, reaching a high of $118.82 before slightly pulling back and rising again, and further breaking through $119. $5,125 is the key resistance for the day. Gold and oil prices have always moved in tandem. Rising oil prices drive up inflation, which supports the rise in gold prices. Currently, the conflict between the US and Iran is ongoing, and the US non-farm payroll jobs decreased in February, raising market expectations for the Federal Reserve to cut interest rates. It is impossible for the Fed to raise interest rates due to the sharp increase in oil prices. Therefore, gold prices have the potential to rise significantly. From the hourly chart, the large double bottom of gold prices has not been broken, and the neckline remains at $5,205.91. This morning, gold prices approached $5,200 but did not break through. It remains to be seen how major players will use market information to break through this level. The Federal Reserve will hold a two-day interest rate meeting next Tuesday. As the authorities are currently more concerned about the performance of the job market than inflation, it is expected that even if the Fed does not cut interest rates next week, it will express its concern about the deterioration of the job market. This could very well serve as an excuse for gold prices to break through $5,200. In the short term, a large double bottom has formed on the hourly chart of gold prices. This week, it is expected to fluctuate upward. The $5,000 level remains a strong support level. Currently, the gold price is approaching the 135-degree angle of Gann at $5,110, and it has fallen by more than $78 today, which is not reasonable. It is expected that the decline will gradually narrow to less than $50. A rebound is also not impossible. It is expected that the 50SMA on the 5-minute chart (currently around $5,074) will be the first strong support level, and $5,125 will be an important resistance level. A breakthrough could lead to a gradual rise and a challenge to $5,200. The above content is for reference only and does not constitute investment advice.
2026-03-06
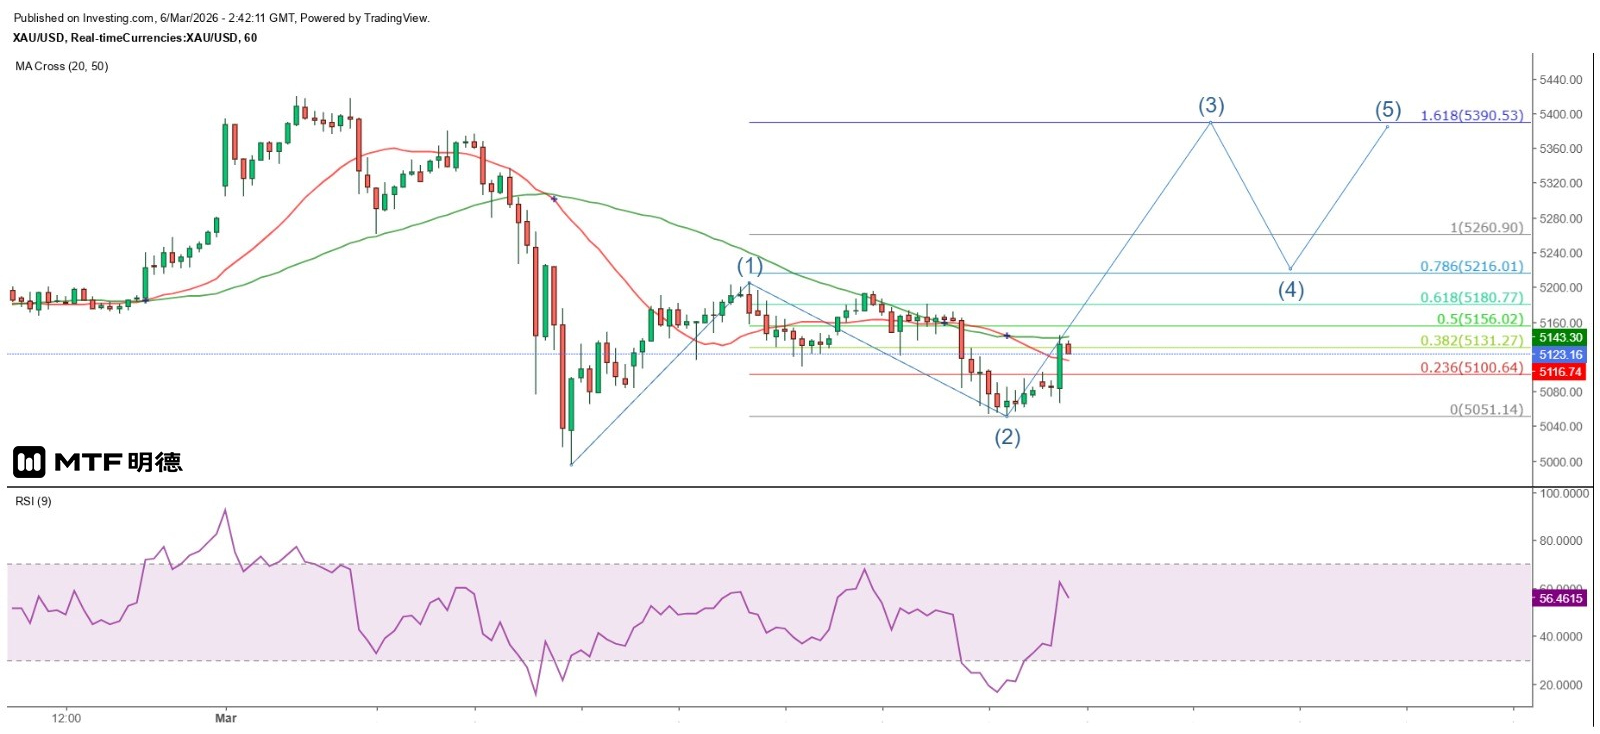
"High Chance of Gold Price Breaking Through $5,200" 6/3/2026 10:40 Completed After entering the European market yesterday, the spot gold price failed to reach a new intraday high and remained in a sideways pattern. It plunged sharply at the beginning of the New York opening and hit a low of $5,051.14 in the second half of the afternoon session. It then gradually rebounded. This morning, in the early Asian session, it rose sharply and returned above the $5,100 level. The current high is $5,144.05. The hourly chart of gold prices clearly does not show an ascending triangle as predicted yesterday, but rather a double top pattern, with the top at $5,205.91. Traders' strategy seems to be to break through the neckline at $5,109.19 and target the previous low at $4,996.15, creating a higher-level double bottom pattern. Alternatively, from the perspective of wave theory, a second wave decline is unfolding. This morning, gold prices rebounded significantly, suggesting that the short-term corrective wave may have ended and that it is likely to rise with the release of the US February non-farm payroll data and the Federal Reserve's FOMC meeting on March 17 and 18. Assuming that the gold price has completed the second wave adjustment as expected on the hourly chart and has entered the third wave, the gold price is bound to break through $5,205.91. Calculated based on the third wave's increase being 1.618 times that of the first wave, the gold price will rise to $5,390.53. Based on the Fibonacci 100% extension, the gold price will also rise to $5,260.90. $5,260 is exactly at the 180-degree angle of the Gann Square, which is a strong resistance level. Therefore, the current judgment is that the short-term adjustment of the gold price is very likely to have ended. The next target will be to challenge $5,205.91, and if it breaks through, it will then aim for $5,260. If it encounters resistance and falls back, $5,200 will be regarded as an important support level. Eventually, it will rise to $5,390.53 before another pullback. The target of the fourth wave adjustment is close to but not lower than $5,205.91. Currently, the gold price is still constrained by the 50SMA on the hourly chart (currently around $5,117). If it breaks above this line intraday, the probability of the subsequent development as expected will be relatively high. The above content is for reference only and does not constitute investment advice.
2026-03-05
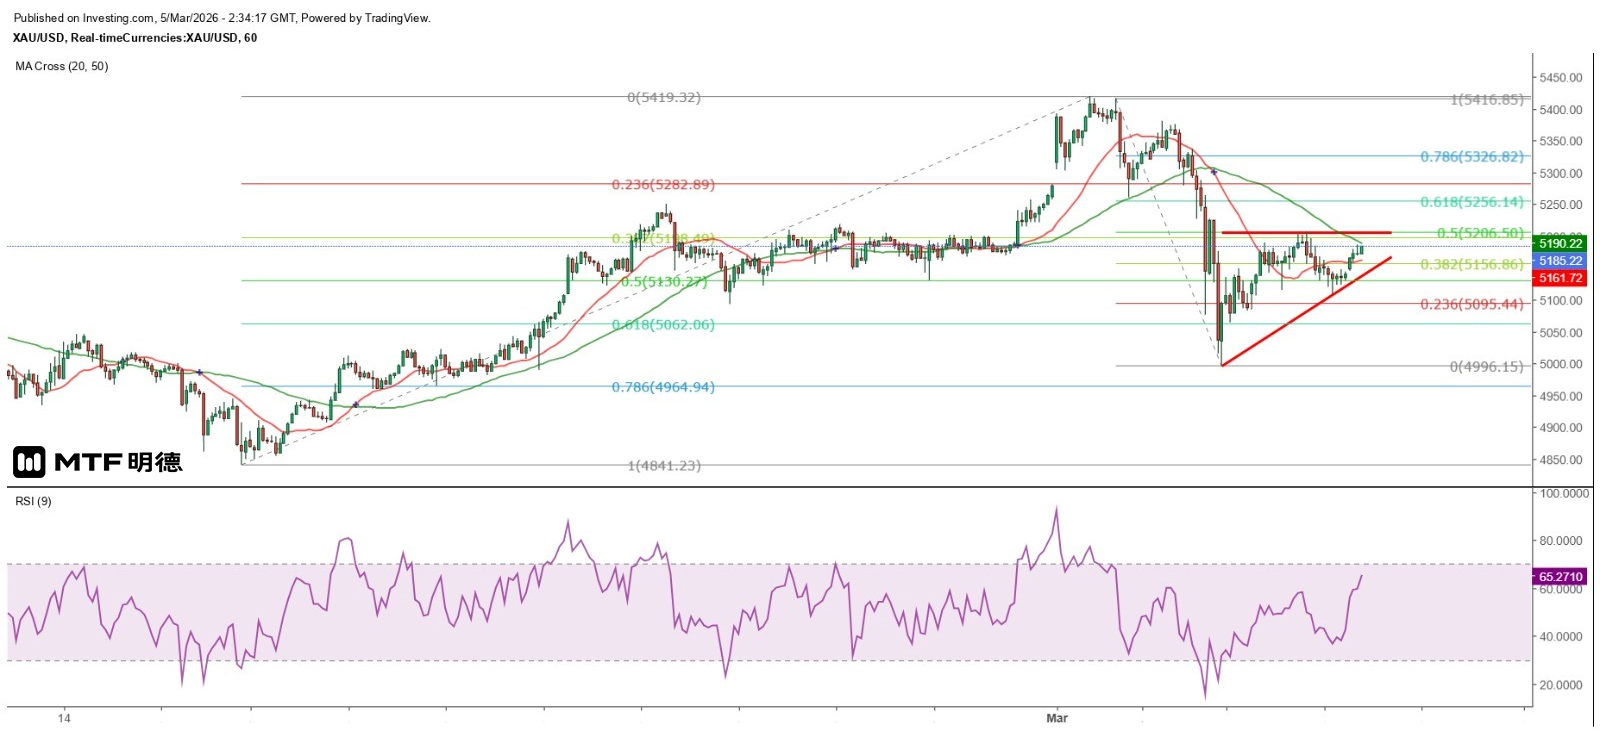
"Gold Prices Forming a Flat-Top Ascending Triangle" 5/3/2026 10:42 Completed Yesterday, gold prices were in a sideways pattern. The spot gold price dropped to $5,115.94 at the beginning of the European trading session, then rose repeatedly. Although it broke through $5,200 at the start of the New York trading session, it failed to sustain the momentum after reaching $5,205.91 and plunged to $5,165.55 before rebounding. However, it was unable to challenge the $5,200 mark and stopped at $5,196.37, then showed a downward trend. It hit a low of $5,109.19 towards the end of the New York trading session before rebounding again. Today, in the early Asian trading session, it rose to $5,186.52 before fluctuating. It is currently seen to have strong support around $5,170. Yesterday, the gold price's low in New York City was very close to the 135-degree angle of Gann Square at $5,110, so it is expected that the gold price's fluctuation range will start to narrow upwards, and $5,110 will become an important short-term support level. From the hourly chart, the gold price is gradually forming a narrowing triangle. The daily high of $5,205.91 in New York City yesterday was very close to the median of the fluctuation range since March 2nd at $5,206.5. The gold price was again blocked at this level, reflecting that the bulls lack the confidence to break through this level. However, investors should still be aware that the gold price may gradually evolve into a flat-topped ascending triangle on the hourly chart, with $5,206.5 being the top resistance. If the gold price continues to challenge this resistance, it is expected to eventually break through it. In this case, the gold price is likely to challenge the strong resistance at $5,260, which is the 180-degree angle. If it breaks through and holds this level, it is likely to further challenge $5,410. The situation in the Middle East remains unstable, and the US Department of Labor will also release the February non-farm payroll report tomorrow. It is expected to add 58,000 jobs, far fewer than the 130,000 in January, with the unemployment rate remaining at 4.3%. This will provide upward momentum for the gold price. If the gold price briefly breaks through $5,210 in the short term, it may be a prelude to a genuine breakthrough. The above content is for reference only and does not constitute investment advice.
2026-03-04
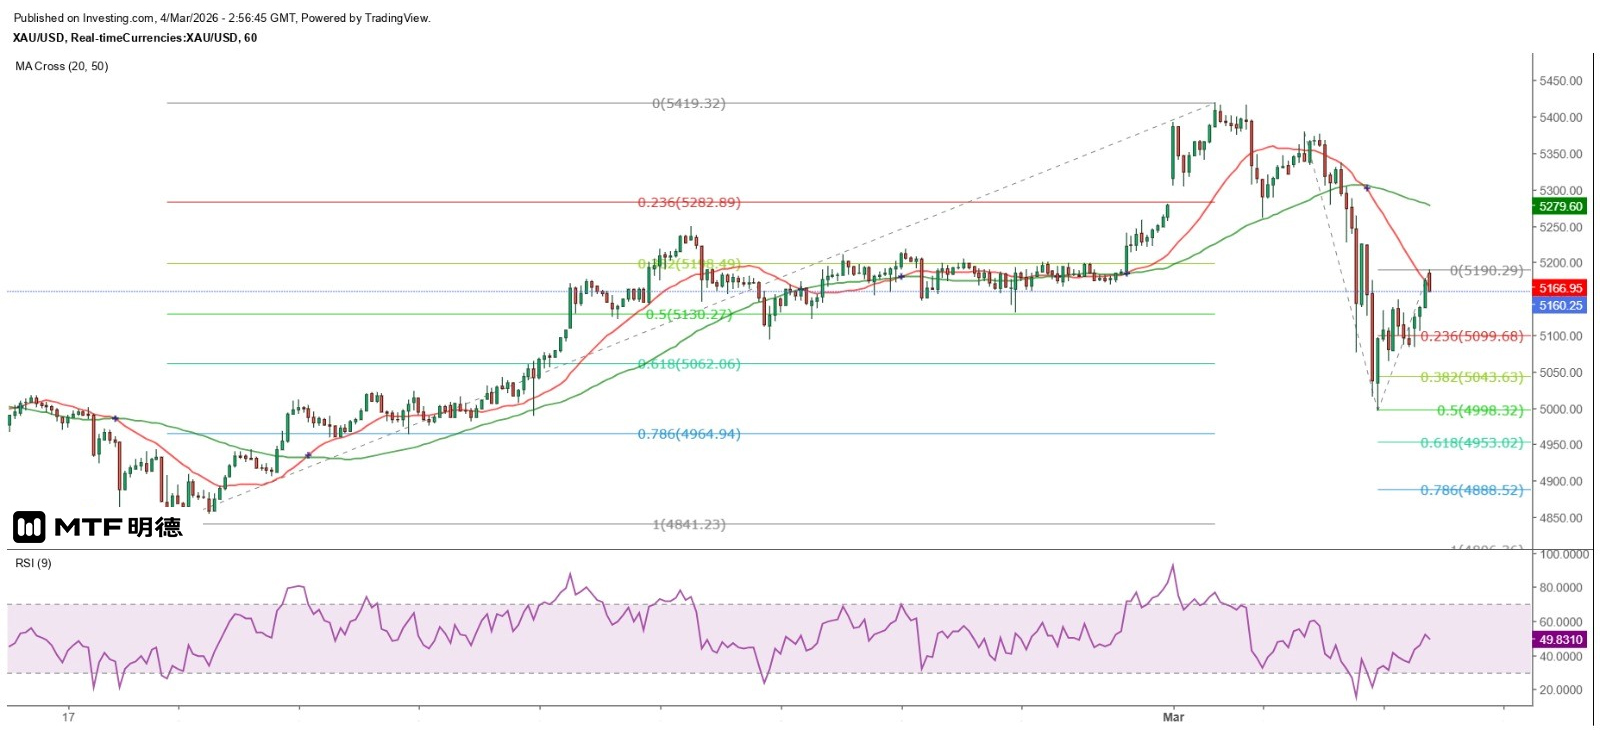
"Gold Prices Expected to Maintain a Pattern of Repeated Declines" 4/3/2026 10:56 Completed Yesterday, the gold price plummeted, with the spot gold price falling by nearly 385 US dollars at its maximum, marking the biggest drop since the record high in late January. The reason for this can be closely related to the political situation in the Middle East. Yesterday, I pointed out that the Middle East situation had a short-lived safe-haven effect on the gold price, but instead had a negative impact. Iran has indeed blocked the Strait of Hormuz and attacked oil tankers, rendering the waterway completely useless. This will lead to delays in oil tanker deliveries and a sharp rise in oil prices, causing funds to shift from the gold market to the oil market. In addition, the market took this opportunity to hype up that inflation would rise as a result, reducing the possibility of the Federal Reserve cutting interest rates. The long-suspected AI bubble burst as a result, causing a sharp drop in the US stock market. The recent rebound failed to break through the $5,400 mark, and gold, which was seeking direction, became a cash-out tool. The spot gold price dropped to a low of $4,996.19 and then gradually recovered. Today, it rose to a high of $5,190.29 in the early Asian session before falling again. Technically, the gold price uses the thousandth place as the ultimate support (or resistance). After testing the $5,000 mark yesterday and then pulling back, it can be tentatively judged that the gold price has found strong support at this level in the short term. However, it should be noted that the decline yesterday was relatively large, and a strong rebound after testing the $5,000 mark was not unexpected. Nevertheless, the gold price resumed its decline from $5,190 this morning. The high point this morning was slightly higher than the median of yesterday's range at $5,188.11, indicating that the gold price may have completed its rebound. Even if the target is set at $5,000, there is still an operating space of $190. If the Fibonacci extension lines are used to measure the movement since yesterday's high, a 100% decline would bring the gold price down to $4,806.36, while a 50% drop would see it fall to $4,998.32. Based on this, there is a possibility that a double bottom could form around $5,000, or the price could break through the February 17th low before rebounding strongly. From the Gann Square perspective, the gold price entered the 90-degree range at $4,960 yesterday, thus encountering strong support. The rebound high reached $5,190, which is relatively close to the 180-degree angle at $5,260 (far from the 135-degree angle at $5,110). Therefore, it is estimated that the gold price will remain within a range of 300 dollars between 4960 and 5260 dollars in the short term. In the short term, the gold price has now fallen below the 20SMA on the 5-minute chart (currently about 5169.5), and there is a greater chance of testing the 50SMA (currently about 5141.7). It is expected to rebound afterwards and challenge the 20SMA, and 5190 dollars is likely to be the intraday high. The trend is expected to remain volatile and downward. The above content is for reference only and does not constitute investment advice.

2026-03-03
"Gold Prices Tend to Fall Repeatedly This Week" 3/3/2026 10:29 Completed From the performance of gold prices yesterday, it can be seen that the safe-haven effect of the Middle East political situation on it is short-lived, and gold prices also lack the momentum they had last year when they were in a strong uptrend. Regarding the military actions that the US and Israel may launch against Iran, the US side has already stated that it will not engage in a protracted war. It is reported that Trump believes that there is no need to deploy ground troops in Iran. Spot gold prices rose to a high of $5,393.34 in the early Asian session yesterday, but then dropped rapidly. They rose again to a high of $5,419.32 in the early European session and then fell slowly. In the early New York session, they rose to $5,416.85 but were then blocked and fell. At the close of the London market, they fell to a low of $5,261.23, completely filling the gap in the early Asian session and being nearly $20 lower than the closing price of last Friday. They then gradually recovered. However, in the early Asian session today, they rose to $5,380, slightly breaking through the adjustment low of $5,375.82 before the New York opening yesterday, but then met resistance and fell again. The temporary low was $5,333.37. $5,280 is the key resistance for the day. Yesterday, the high and low of gold prices were roughly between $5,260 at the 180-degree angle of the Gann Square and $5,410 at the 225-degree angle, representing a relatively wide range of fluctuations. The adjustment low in New York City was close to the 50SMA on the hourly chart (currently around $5,353.95), and was not far from the high of the upward trend from February 17 to 24 at $5,230.64. The subsequent resumption of the upward trend was also expected. Assuming that the market's risk-averse sentiment has not completely dissipated, even if gold prices have the strength to rise, it would be extremely difficult to break through $5,410 and then climb significantly further. Personally, I rule out the possibility of a sustained rise in gold prices and instead pay attention to the opportunity for a continued downward adjustment. In the short term, it is expected that the gold price will remain within the range of $5,260 to $5,410. The first key resistance level is at $5,380, followed by $5,410. From the perspective of short-term cyclical trends, the gold price has already peaked yesterday, or in other words, the top of this week has been formed. The trend for this week is likely to be a repeated decline. Measuring the movement since yesterday's high with the Fibonacci extension, a 100% extension would bring the gold price down to $5,221.99. If it retraces 50% of the largest increase since February 17th, the gold price will reach $5,130.27. The above content is for reference only and does not constitute investment advice.
2026-03-02
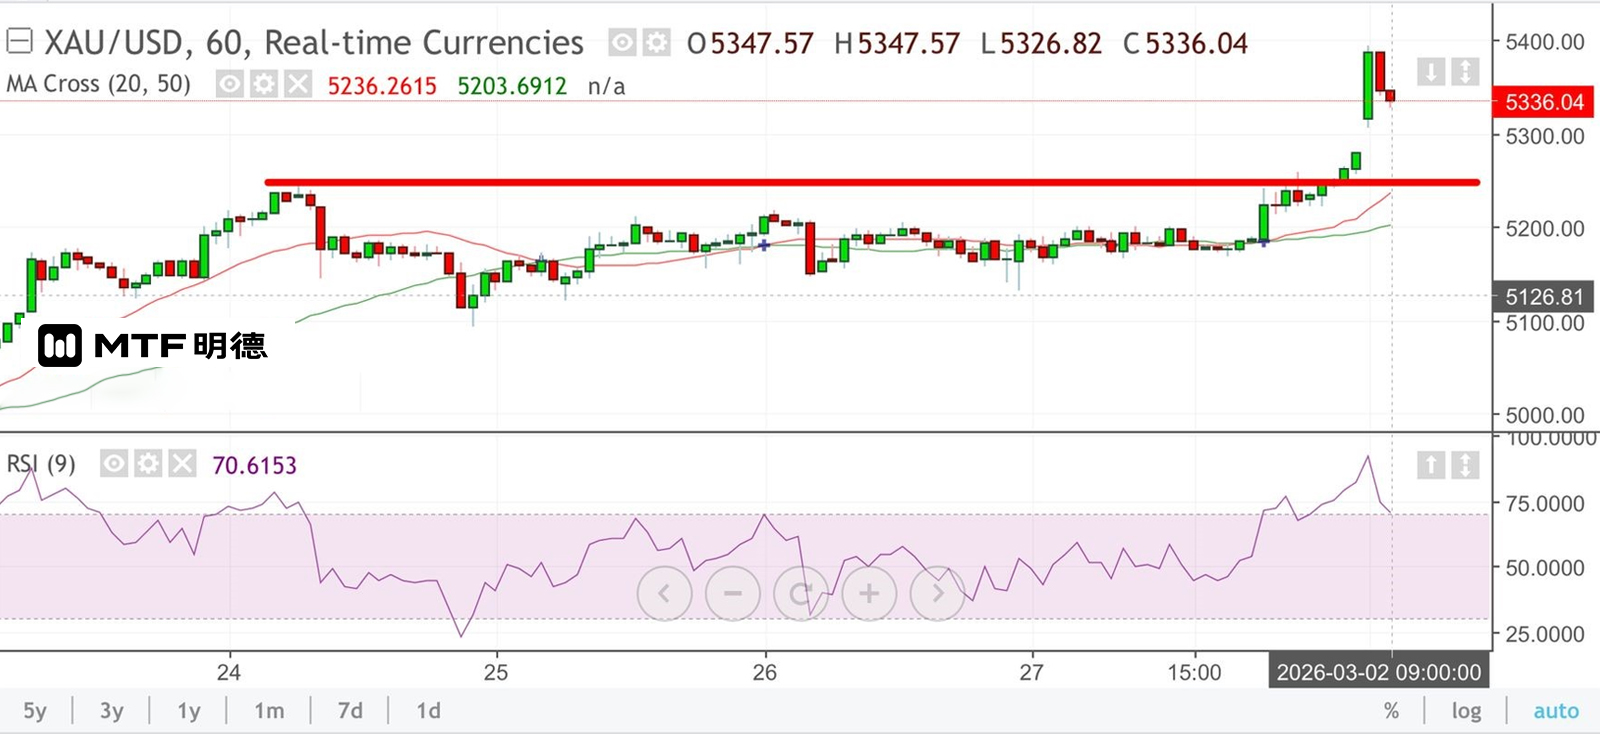
Gold price rises close to $5,410, faces strong resistance 2/3/2026 09:04 Finalized On February 28th, the United States and Israel launched a joint military operation against Iran. Iran's Supreme Leader Ayatollah Ali Khamenei and dozens of military generals were killed in the attack. It was also reported that three US soldiers were killed. In response, Iran launched missiles at US military bases in the Middle East. Additionally, an oil tanker was attacked and sank in the Strait of Hormuz. Investors' risk aversion sentiment has intensified. International oil and gold prices have risen sharply in the early Asian market this morning. New York crude oil once approached $75 per barrel. Spot gold prices opened with a large gap and rose to as high as $5,393 per ounce before experiencing a significant pullback. However, after slightly breaking through $5,350 per ounce, it found support. Silver prices also slightly retreated after approaching $96.4 per ounce. Although Trump stated that Iran is willing to negotiate with the United States, he also expected that the US military operation against Iran would last for four weeks. Therefore, it is believed that the risk-averse sentiment in the financial market will be difficult to cool down in the short term. As for the gold price, 5360 is located at the 270-degree angle of Gann, but the gold price has approached 5400 US dollars. Under the current circumstances, the gold price still tends to repeatedly test the high level. In the short term, it is expected that the gold price will likely fluctuate within the range of $5,310 to $5,410, but with increased volatility. Although the gold price has risen sharply due to the above-mentioned events, it can still fall by more than $40 from its peak, indicating that the market believes the military disparity between the United States and Iran is significant, and the resulting risk-aversion actions will not last long. Therefore, investors should not expect the gold price to soar as a result, but rather be prepared for a significant correction. The above content is for reference only and does not constitute investment advice.
2026-02-27
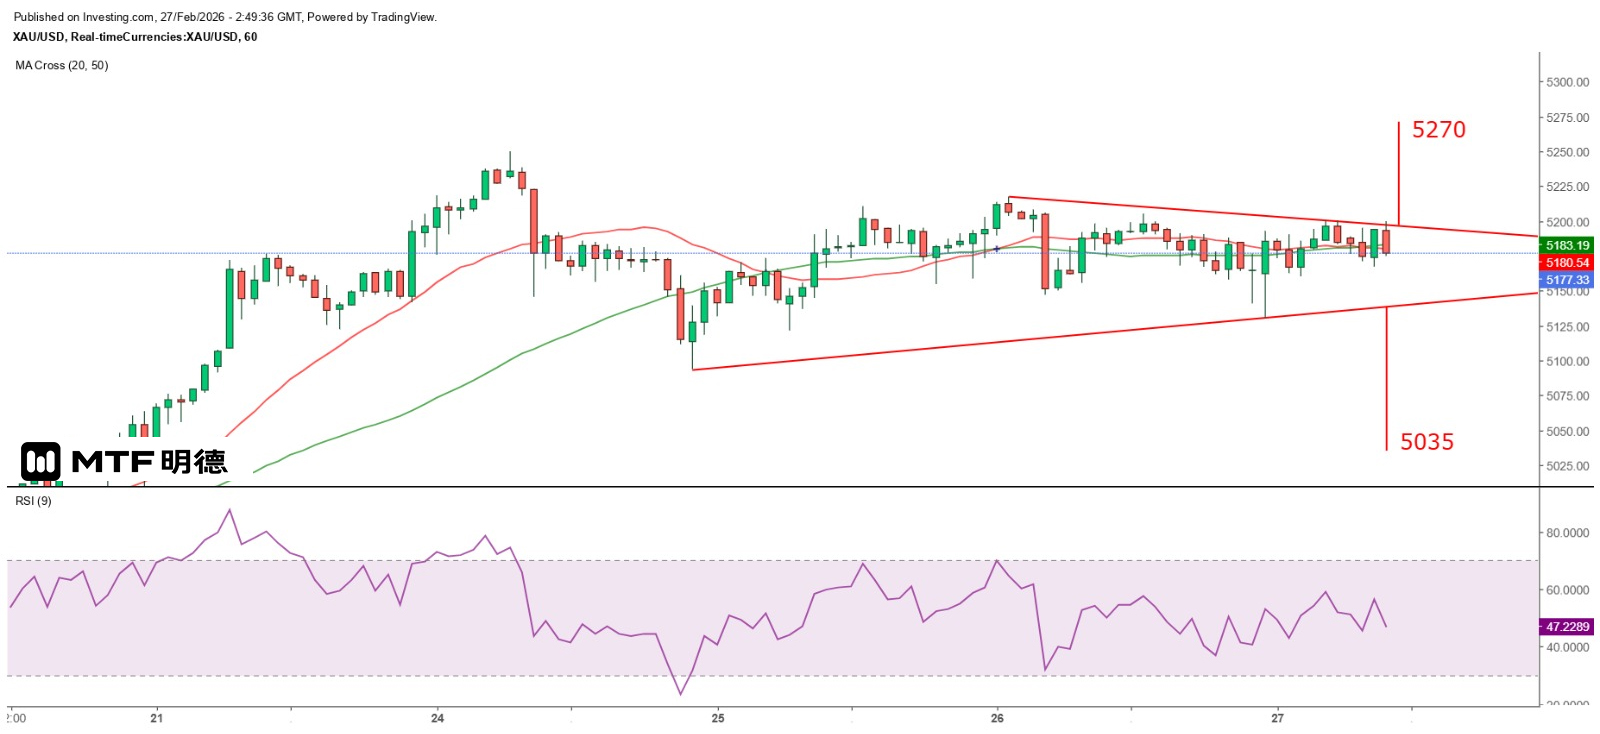
"Gold Price Faces Obvious Resistance at $5,200" 27/2/2026 10:49 Completed Gold prices have maintained a volatile pattern, with the resistance at $5,200 becoming increasingly prominent. Yesterday, the spot gold price rose to $5,205.43 in the early afternoon session in Tokyo, but was clearly pressured by the large bearish candlestick seen in the late New York session on Wednesday. It then continued to decline, and near the end of the New York session yesterday, it even plunged sharply to $5,130.98. However, on the hourly chart, it closed with a long-tailed bullish candlestick that broke through the previous high, indicating that in the short term, the gold price is more likely to fluctuate within the range of $5,130.98 to $5,206.25. However, if it breaks through this range, it is expected that the gold price will enter a one-sided trend market. As the gold price is in a sideways movement on the hourly chart, the SMA on the hourly chart has lost its effectiveness. However, the SMA on the 5-minute or 1-minute chart can still provide entry references. I believe that the sudden shift of the gold price to a sideways market is mainly due to the lack of news for speculation. The sudden drop in the gold price yesterday may also be related to the remarks of US Vice President Vance. He stated that a military strike against Iran is unlikely to lead to a protracted war. In other words, the gold price is unlikely to continue to rise due to geopolitical risk factors. Spot gold prices once again approached the $5,200 mark in the early Asian session today, reaching a high of $5,199.79, but were once again held back and fell, confirming that the $5,200 resistance level is not easily broken. As the gold price develops, the double top pattern on the hourly chart has turned sideways, but $5,139.22 remains a key support level. Measured by the TD line, if the gold price breaks above the downtrend line on the hourly chart, the upward target is approximately $5,270. Since the previous hour was a bullish candle, the current sudden drop is considered invalid. Conversely, if the gold price breaks below the downtrend line, the measured target is approximately $5,035. The above content is for reference only and does not constitute investment advice.
2026-02-26
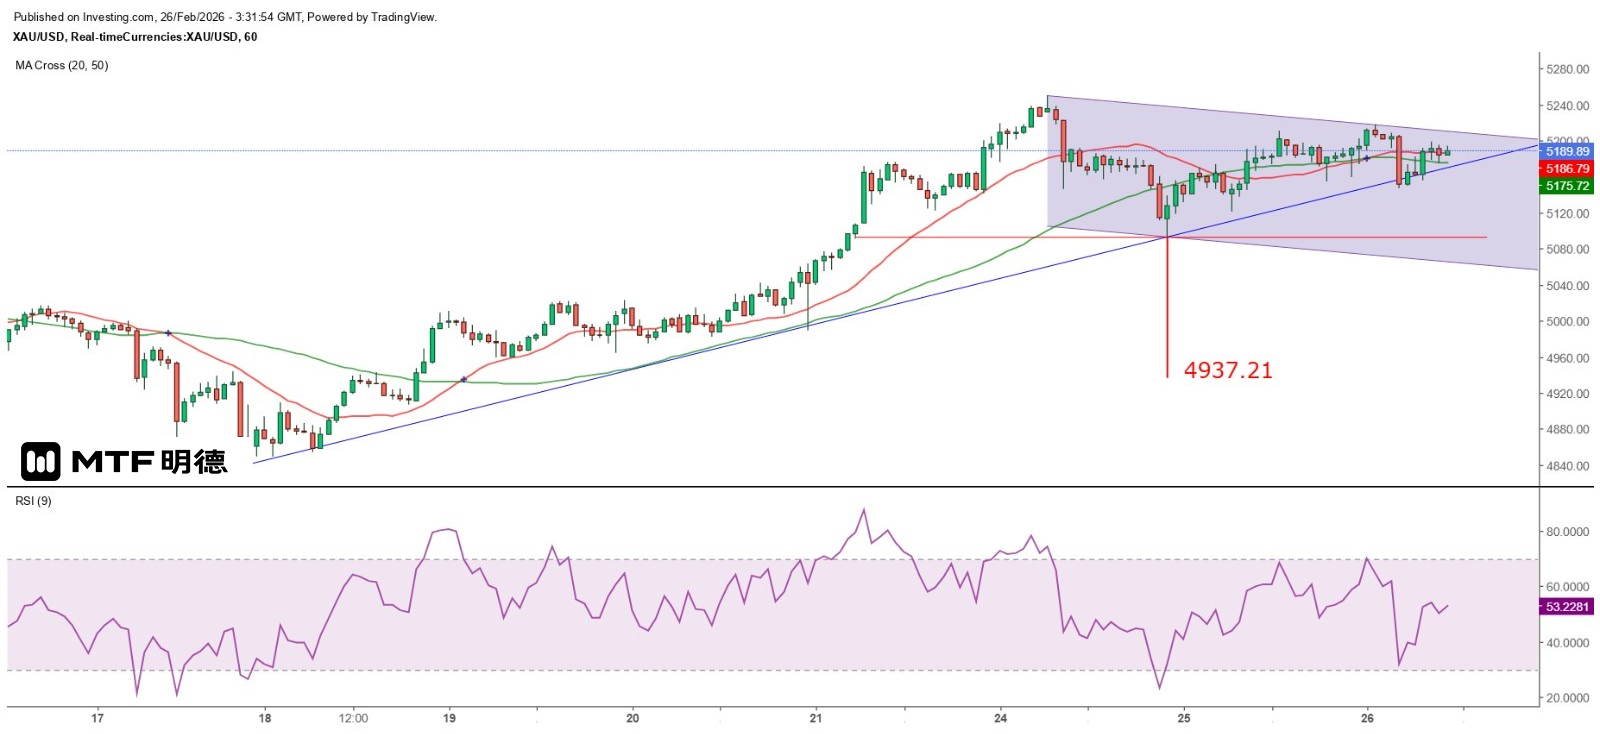
"Gold Price May Fall Back After Forming a Double Top" 26/2/2026 11:27 Completed The spot gold price rose to $5,210.57 at 1 p.m. yesterday, then fell and rose again, and reached $5,217.84 at 1 a.m. this morning. However, it failed to close above $5,200 and instead plunged sharply towards the end of trading in New York, hitting a low of $5,147.42. From the hourly chart, the upward trend of each wave being higher than the previous one since February 17 has changed. Yesterday's sharp drop has led to a lower high, and it remains to be seen whether it will turn into a downward trend. The large bearish candle formed on the hourly chart yesterday has its top at $5,206.25, which has become an important short-term resistance level. From the shape of this candle, there are three possible interpretations: one is that it will turn into a trend of each wave being lower than the previous one; the second is that it will turn into a narrowing triangle; the third is that it will form a new upward trend with the low point on February 24th as the starting point. From a risk perspective, the first scenario must be watched out for, especially the large bearish candle that appeared in the late New York session yesterday, which indicates that the selling pressure at $5,200 is heavy in the short term, and secondly, it reflects that the downward force is currently in control. Also, it is necessary to pay attention to whether a double top pattern has formed on the hourly chart. If it has, $5,093.59 will be regarded as the neckline. Once it is broken, the measured decline target will be $4,937.21. From a smaller 5-minute time frame, the gold price dropped sharply yesterday and then gradually rebounded, presenting a pattern of each wave being higher than the previous one. This indicates that the gold price is either in a downward trend or still in an upward trend, depending on the time frame from which one observes. It should be noted that the larger the time frame, the higher the potential risk and return; the shorter the time frame, the lower the potential risk and return, and the more frequent the trading signals will reverse, increasing the transaction costs. Therefore, to profit from the gold market, one should not be dominated by personal character but should select the appropriate time frame from a risk perspective and fully follow the market signals for trading. The above content is for reference only and does not constitute investment advice.
2026-02-25
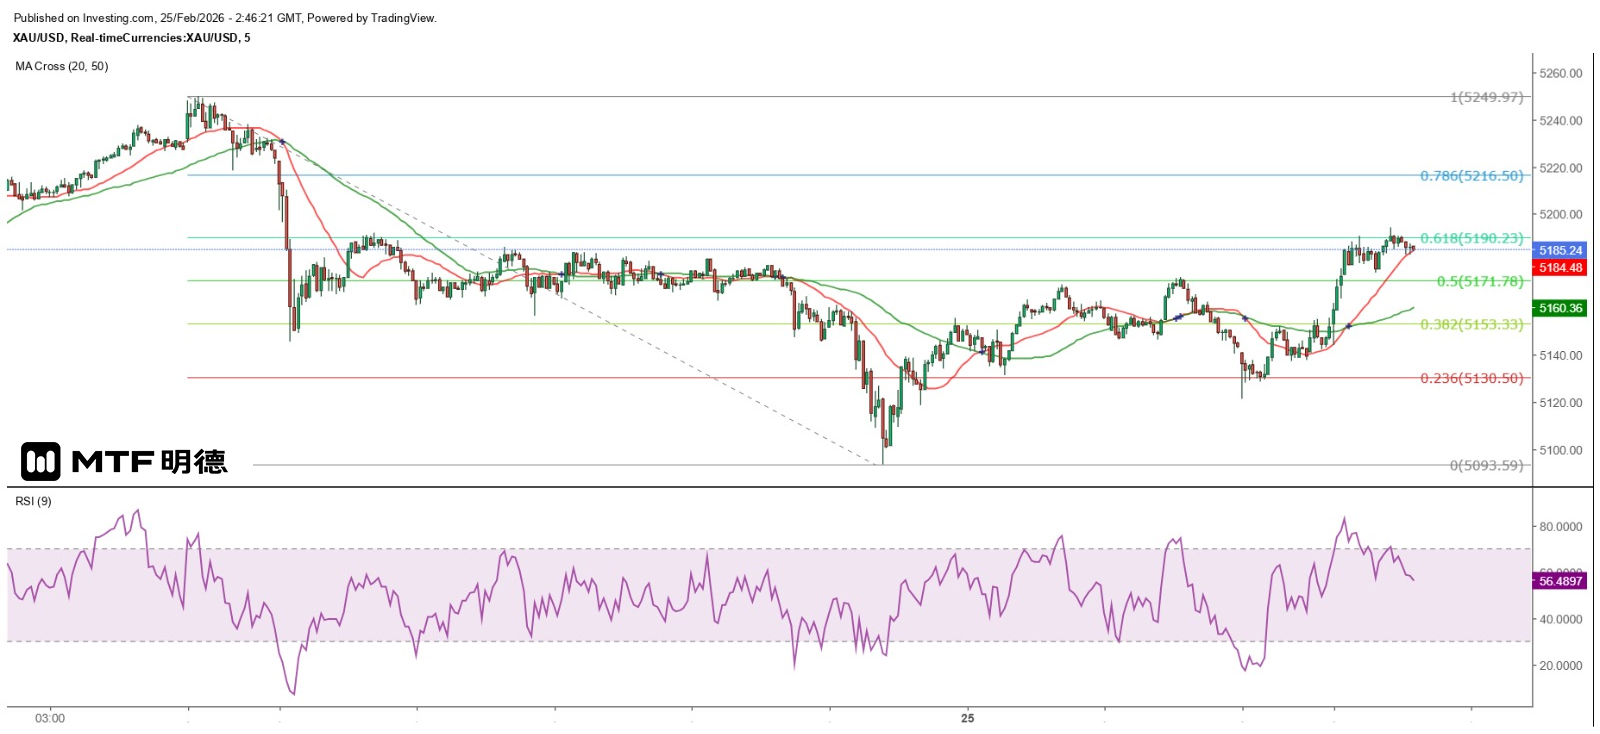
"Gold Price Expected to Break Through $5,200" 25/2/2026 10:44 Completed Yesterday, the spot gold price was mostly trading between $5,055 and $5,185 in the Asian session. However, it plunged sharply at the beginning of the New York session and briefly fell below $5,100, hitting a low of $5,093.59 before rebounding. It then encountered resistance at around $5,173 towards the end of the New York session and retreated. This morning, in the early Asian session, it dropped to $5,121.57 but soon strengthened again, continuously reaching intraday highs above $5,190. It has now surpassed the rebound high of $5,191.93 from yesterday's sharp decline in the Asian session. $5,200 is expected to be a key technical resistance level for the day. If it is broken through, the gold price is likely to embark on a strong upward trend. From the hourly chart, it can be seen that the gold price has shown single-hour reversal signals both in the early New York session yesterday and in the Asian session this morning. It has also been in a pattern of each wave being higher than the previous one. Currently, it is challenging the 61.8% retracement level of the biggest decline since yesterday, which is at $5,190.23. As this level is also the top resistance of the main consolidation range yesterday and is close to the psychological level of $5,200, it is expected to encounter significant resistance. However, if it breaks through this level, the top of the large bearish candle formed in the early Asian session yesterday at $5,222.6 will be the target for this rebound wave. Further upward, it may challenge the 180-degree angle of Gann Square at $5,260. In fact, the low point this morning was already significantly above the 135-degree angle of $5,110, indicating that gold has regained its footing above $5,100. Currently, the probability of the price moving towards $5,260 is relatively high. The median between the two, $5,185, can be regarded as the dividing line between bullish and bearish trends. Meanwhile, $5,147.5 (the median between $5,110 and $5,185) is an important support level. Therefore, even if the gold price fluctuates below $5,185, as long as it remains above $5,147.5, it cannot be said to be weakening. Additionally, the 20 and 50 SMA on the 5-minute chart can be seen as strong support or reversal points. Investors should not set their stop-loss levels above these two SMAs. On the contrary, when the gold price drops to either of these SMAs, it can be considered a buying opportunity. The above content is for reference only and does not constitute investment advice.
2026-02-24
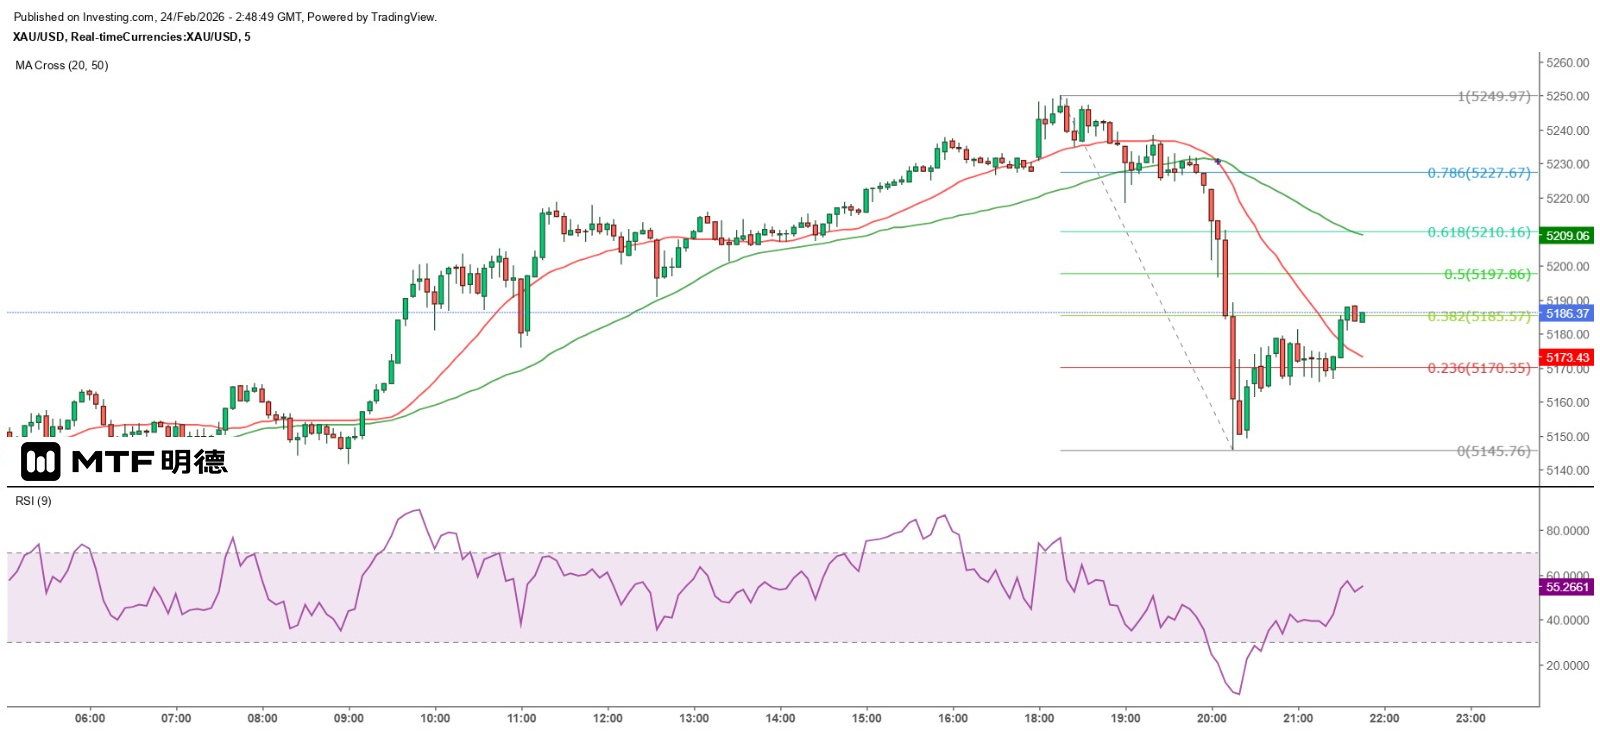
"Gold Price Poised to Again Test $5,260" 24/2/2026 10:45 Finalized Yesterday, the gold price was extremely volatile. The spot gold price reached a high of $5,176.53 in the early Asian session, then formed a small double top on the 5-minute chart and fell. After hitting a low of $5,122.7 in the early European session, it rebounded and broke through the top of the previous sideways range at $5,119.22, confirming the breakout signal. Subsequently, the gold price consolidated at a high level and continued to rise in the early New York session, reaching a high of $5,237.48, consistent with the direction we mentioned yesterday that it would challenge $5,260. As $5,260 is located at the 180-degree angle of Gann's Square, it is a strong resistance level. This morning in the early Asian session, gold prices rose further to $5,249.97 and then plunged sharply, hitting a low of $5,145.76. Moreover, the hourly chart closed below the 50SMA (currently around $5,211.72), and then gold prices fluctuated above this line. The closing below this level increases the risk of further decline, but currently, gold prices have just broken through the top of the previous sideways range, and the risk factors of geopolitical situations are brewing, providing support for gold prices. Yesterday, it was pointed out that Monday was the short-term cyclical top for gold prices. Due to the sharp drop this morning, selling pressure has been reduced and there is a strong possibility of a rebound. In the short term, gold prices have risen above the 20SMA (5175) on the 5-minute chart. The next resistance level is at the 50SMA (5210). However, since this level was already broken yesterday and is not a strong resistance or support level in Gann's square, gold prices are likely to challenge the resistance at $5,250 from yesterday again, and even break through $5,260, approaching $5,300 before falling back in a double top pattern. Gold prices are expected to consolidate between $5,160 and $5,210 today before breaking out upward. $5,260 is still considered a strong resistance level, and the range of $5,260 to $5,310 is a strong resistance zone. It is expected that the volatility of gold prices above $5,260 will increase, and the bullish and bearish battles will become more intense! The above content is for reference only and does not constitute investment advice.
2026-02-23
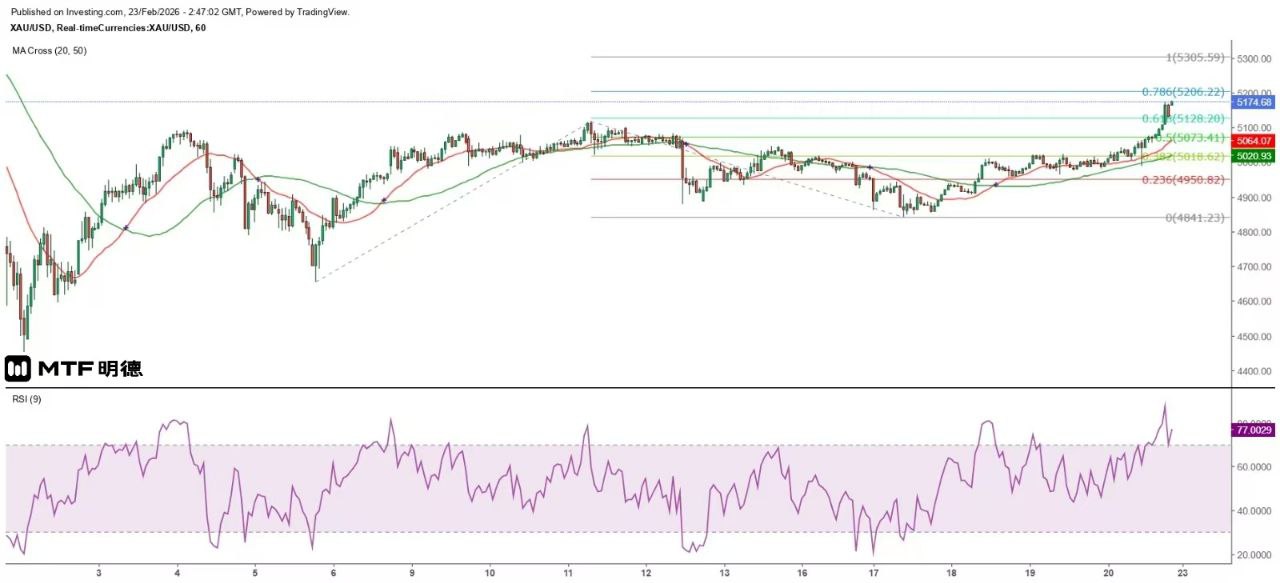
"Gold Price Tends to Test Higher Intraday" 23/2/2026 10:45 Finalized After the US Supreme Court ruled that the reciprocal tariffs imposed by the Trump administration on foreign countries were unconstitutional, Trump promptly signed an executive order to impose temporary tariffs, which took effect at 00:01 on February 24, Eastern Time. For 150 days, a 10% tariff will be levied on goods imported by US importers. Some goods, including certain critical minerals, metals used for currency and gold and silver bars, energy and energy products, will be exempt from the new tariffs. However, the next day, Trump raised the new tariffs to 15%. On the other hand, according to The New York Times citing sources, Trump told his advisers that if diplomatic efforts or any initial targeted strikes failed to force Iran to abandon its nuclear program, he would consider launching a larger-scale attack on Iran in the coming months with the aim of ousting the Iranian leadership. $5,300 is a strong resistance level. Gold prices broke through $5,100 in the late New York session last Friday and rose further in the early Asian session today. Spot gold once reached a high of $5,171.72, although it quickly retreated to $5,131.83. However, it climbed again and surpassed $5,160. From the daily chart, it is still uncertain whether gold prices can break through the top of the sideways range formed after the sharp decline in late January, which is $5,119.24. If today's close is above this level and there is no strong reversal signal of a double-day turn, the breakout can be confirmed. At that time, gold prices are expected to challenge $5,260. Otherwise, gold prices may return to fluctuate between $5,000 and $5,100. On the other hand, if the Fibonacci extension line is used to measure the movement since February 2nd and the amplitude reaches 100%, the gold price could reach $5,305.59. In other words, there is a possibility that the gold price will break through $5,260 and challenge the $5,300 mark before a significant adjustment occurs. It is expected that the possibility of breaking through $5,200 within the day is relatively high, and $5,210 is expected to be the first important resistance level. If this level is broken, it is not impossible for the price to rise to $5,260. After all, a daily fluctuation of more than $100 in the gold price is not uncommon. However, from a short-term perspective, today is exactly the day when the gold price peaks. Investors who chase the gold price at a high level should also be mentally prepared for a sudden drop at any time. The above content is for reference only and does not constitute investment advice.
2026-02-20
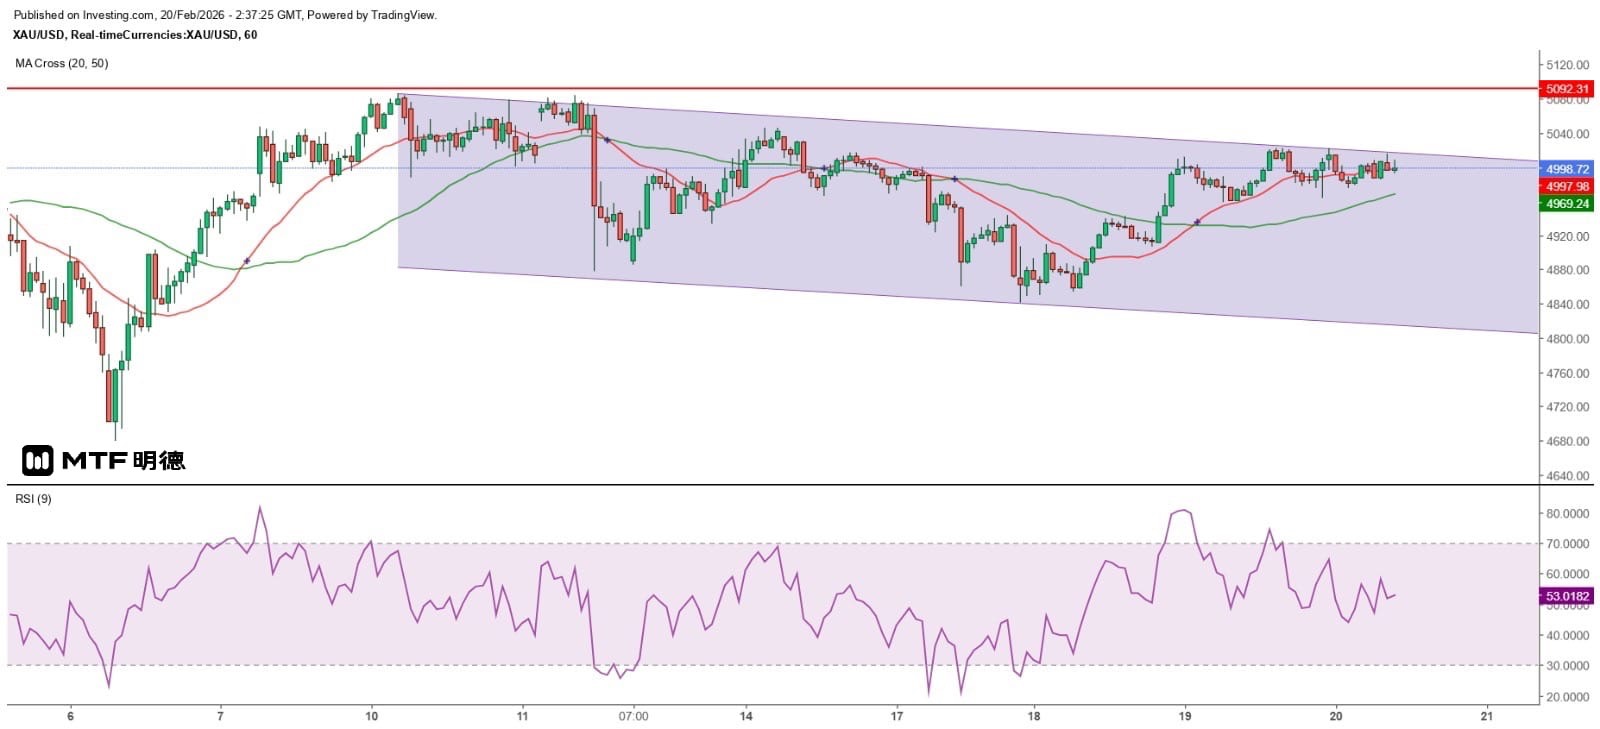
"Gold Price to Remain Volatile in the Short Term" 20/2/2026 10:31 Completed Entering the Year of the Horse, I wish everyone a spirited and successful year ahead! During the three-day Lunar New Year holiday in the past three days, the gold price has remained largely within a range. Although the spot gold price rose above $5,000 on three occasions, it failed to close above that level. From the daily chart, the gold price has closed below the 20SMA (currently around $5,007.33) for three consecutive days, the first time since it re-broke above the 20SMA on November 10 last year. This indicates an increased risk of a further sharp decline in the gold price. From the hourly chart, since the rebound from the low of $4,402 on February 2nd, the gold price has been clearly constrained by $5,100 and has formed a large sideways range, indicating that $5,100 has become an important medium-term resistance level for the gold price. Moreover, over the past three days, it has failed to close above $5,000, which can be regarded as an important short-term resistance level. In other words, the gold price must break through $5,100 to have a chance to break the sideways pattern. Even if it rises back above $5,000, it is very likely to remain sideways between $5,000 and $5,100. Gold prices rose to $5,015 in the early Asian session today, but closed with a bearish candle on the hourly chart. Yesterday, gold prices hit a low of $4,959.15 in the early Asian session and $4,964.09 in the early New York session, both near the 90-degree angle of $4,960 on the Gann Square. Therefore, whether it can hold this level is crucial. If $5,100 is confirmed as the medium-term resistance, the upward test of the 135-degree angle at $5,110 centered on the 90-degree angle at $4,960 has ended, and gold prices will test the 45-degree angle at $4,810 in the short term. Tonight, the United States will release not only the initial estimate of the fourth-quarter GDP but also the December personal consumption expenditures (PCE). It is expected that the overall year-on-year increase will remain at 2.8%, while the core PCE's year-on-year increase is projected to expand from 2.8% to 2.9%. Based on this data alone, the impact on gold prices is negative. However, the United States will also release other important economic data tonight, including the S&P's February PMI, the University of Michigan's February consumer sentiment index and one-year inflation expectations, as well as December new home sales. All of these can serve as excuses for market speculation, and gold prices are expected to remain in a volatile pattern in the short term. The above content is for reference only and does not constitute investment advice.
2026-02-16
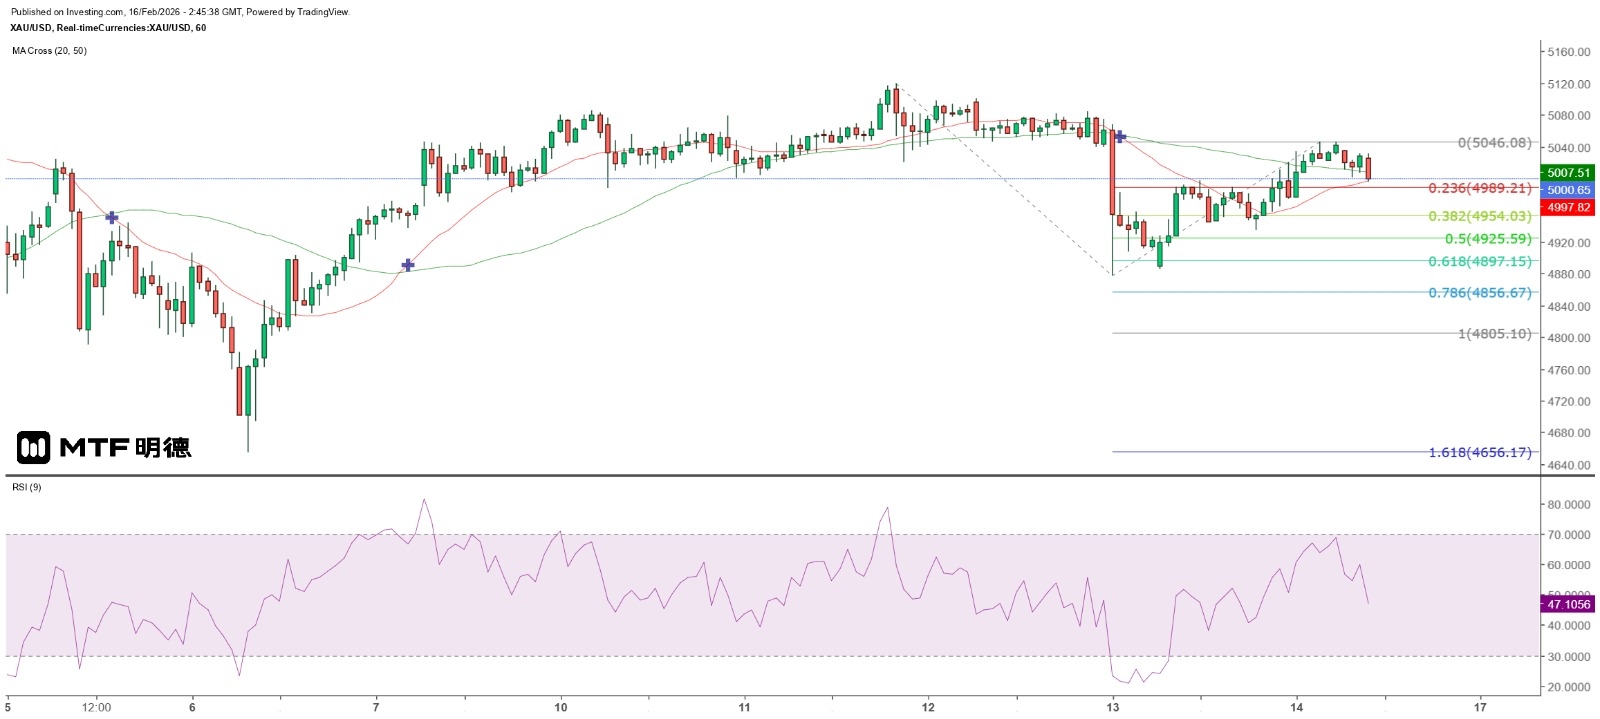
"Gold Price at $5,000 Is Non-Negotiable" 10:44 16/2/2026 Completed The January CPI released by the US Department of Labor last Friday indicated that the pace of price increases has further slowed. The overall year-on-year increase dropped from 2.7% to 2.4%, lower than the expected 2.5%. The year-on-year increase in core CPI decreased from 2.6% to 2.5%, in line with expectations, but it was the smallest increase since March 2021. The data once again provided upward momentum for gold prices, which broke through the $5,000 mark again. In the late trading session in New York, it rose to $5,046.08, then pulled back slightly before making another push to the top, but the highest it reached was $5,045.86. Gold prices opened lower this morning with a gap, forming a small double top pattern on the 5-minute chart. The lowest point reached was $5,001.51, after which it stabilized and rebounded. For now, it seems that a dense area has formed at the top of $5,031. As the US markets are closed today for President's Day, gold prices are likely to remain in a narrow range above $5,000. The US will release the December PCE data this Friday. The market expects the year-on-year increase to expand from 2.8% to 2.9%, and the month-on-month increase to expand from 0.2% to 0.4%. As this is an important reference indicator used by the Federal Reserve to measure consumer spending and inflation, if the data reflects that Americans' spending power has increased due to interest rate cuts, thereby potentially increasing inflationary pressure driven by demand, and if the labor market also stabilizes or even strengthens, it could affect the authorities' monetary easing policy. A slowdown or even halt in the Fed's rate cuts is unfavorable for gold prices. Investors need to consider whether the sharp drop in gold prices at the end of January this year was due to large investors taking profits by selling at high levels or deciding to exit the market. If it was the latter, the rebound from the low point has approached 61.8% of the decline in late January (5140.37), which may be the end of the rebound. Measured by Fibonacci expansion, if the extent reaches 100%, the gold price could fall to $3927.90. In the short term, the $5000 mark is being tested again. If it is breached, the price is likely to fall to between $4960 and $4910 within the day, and $4810, which is at the 45-degree angle of the Gann Square, is a potential target for a further decline. The above content is for reference only and does not constitute investment advice.


