
 en-US
en-US 

 Telegram
 WeChat

2026-04-20
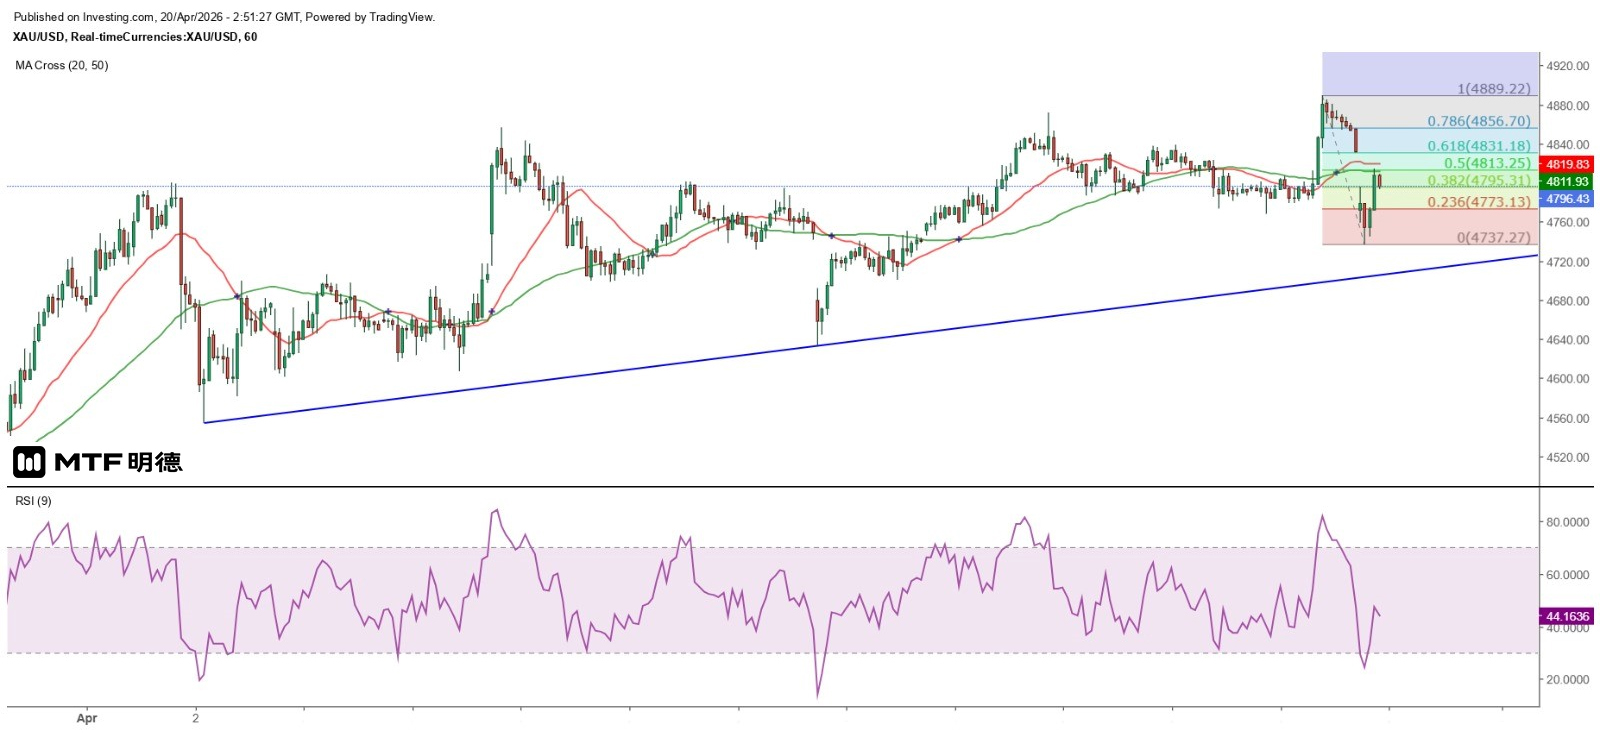
《金价本周料呈偏弱走势》20/4/2026 10:49 完稿 美伊皆指责对方违反暂时停战协议,伊朗再次封锁霍尔木兹海峡,特朗普则表示,如未能在本周三前达成协议,则会再次对伊朗采取军事行动。目前金融市场明显属事件主导型,一言以蔽之,只有美伊双方在核问题上达成协议,美国海军撤出中东,金融市场才再次转向由经济数据驱动。 中东局势变了又变,油金价格继续重复著过去升跌互换的角色。不过,投资者逐渐习惯了中东局势随时出现的变化,因此今早油价虽大幅高开,但纽约原油期货价格触及 89.60 美元后逐步回落至 86 美元水平;即便布伦特原油期货价格反弹力度十足,但触及 97.5 美元后也回落至 95 美元以下。 黄金价格表现疲弱,现货黄金价格低开低走,跌至 4737.27 美元后反弹,但未能完全填补下跌缺口,最高涨至 4814.46 美元后再度下跌,目前在 4800 美元边缘徘徊。从短线周期性走势观察,金价的走势符合上周三的判断,即于上周五触顶或跌势延续至本周初,故亦预料金价本周走势偏弱。 从小时图观察,金价勉强维持上升形态,短期支持位约为4710美元,阻力位为下跌裂口顶部4831美元。从日线图来看,上周五反弹的高位 4889.7 美元非常接近当时 50 日移动平均线的 4892.45 美元,但始终未能突破,因此该线仍是黄金价格中长期的主要阻力所在。从江恩正方形观察,金价料再次返回4810及4660美元范围波动,并以向下发展机会较大,期间4760及4710美元可视为支持金价反弹的短期支持位。 以上内容仅供参考,不构成投资建议。
2026-04-17
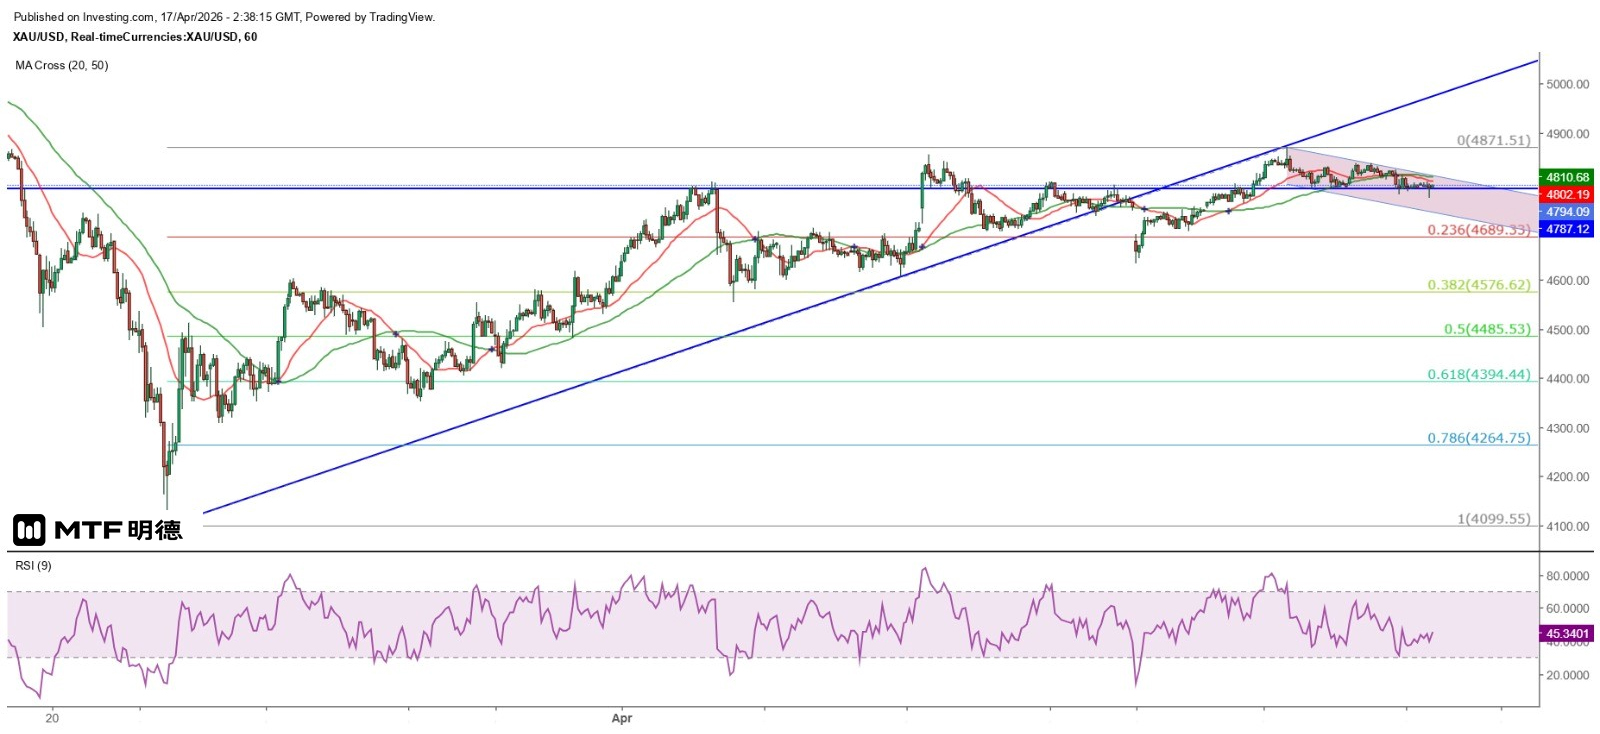
"Gold Price Shows Early Signs of Short-Term Ascending Flag Formation" 17/4/2026 10:33 Completed The global focus remains on whether the United States and Iran can reach an agreement, at which point the United States withdraws its troops from the Middle East, Israel also stops attacking Iran and Lebanon, a ceasefire is achieved in the Middle East, oil prices fall, and the market can shift its attention back to economic fundamentals, the possible meeting between the leaders of the United States and China in May, and the major event of the US midterm elections in November. In addition, Trump couldn't wait to announce the outcome of the US-Iran negotiations. He claimed that Iran agreed not to possess nuclear weapons and promised that the validity period would exceed 20 years, believing that the war with Iran would soon come to an end. However, the US Secretary of Defense stated that if the US and Iran failed to reach a peace agreement, the US military was ready to take military action again. Iran's top military advisor to the Supreme Leader, Rezaei, also said that Iran's missile launchers were ready to sink all US warships. Financial markets are optimistic about the end of the conflict between the US and Iran. The S&P 500 and Nasdaq have reached new highs. After testing the $90 mark on Tuesday, New York crude oil is now holding steady at around $93. Gold hit a high of $4,871.78 on Wednesday but reversed course in a single day. Although it has tested recent lows for three consecutive days, the distance is significant and it shows the early signs of a small ascending flag pattern. In the short term, two important support levels need to be watched, namely $4,741 and $4,655 (20 SMA). If gold finds support at $4,741, it is more likely to hold above $4,810 and may further challenge $4,860. Even if it drops to around $4,655, it is expected to hold above the 20 SMA and rebound. However, the 50 SMA (currently around $4,891) will then become a resistance level. The above content is for reference only and does not constitute investment advice.
2026-04-16
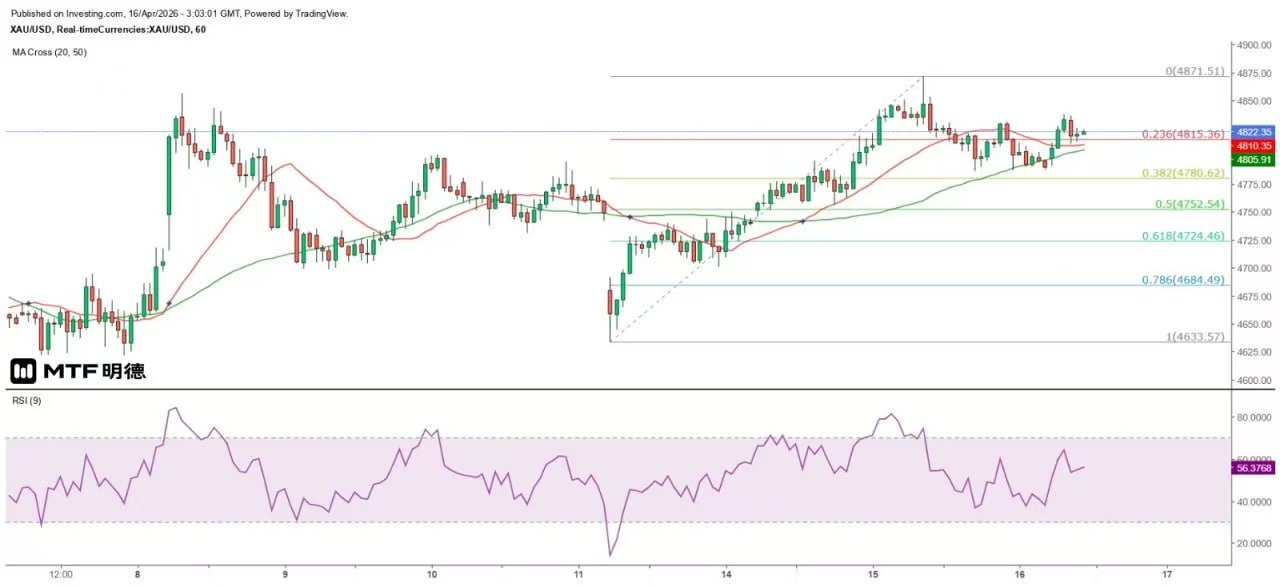
Gold Price of $4810 Becomes Short term Strong Support "Completed on 16/4/2026 11:01 The gold price fell repeatedly after reaching a high of $4871.51 in the early session of the Asian market yesterday, and reached a low of $4786.62 before the European afternoon market. It also fell to the level of $4787 before the London market closed and at the end of the New York market. This morning, it started a rebound wave, with a temporary high of $4837.72. From this, it can be inferred that $4787 has become an important short-term support, but on the other hand, the double peak pattern of gold prices on the hourly chart is still valid, with $4871.51 being an important resistance. Today, the gold price rebounded and retraced the hourly charts of 50SMA (now around 4805) and 20SMA (now around 4810). If the gold price continues to fluctuate above 20SMA, there is still a chance to challenge the double top resistance of $4871.51 during the day. Currently, I still maintain the view that the gold price will hit the top and fall back this Friday, or the downward trend may continue until early next week. In the coming days, the second round of negotiations between the United States and Iran will inevitably affect the performance of gold prices (and oil prices), and based on the current situation, the dominant power is in the hands of the United States, so it is expected that there is a high possibility of reaching an agreement. However, does this mean that the inverse relationship between falling oil prices and rising gold prices will continue? If oil prices fall back below $70 in early March, gold prices should rise to $5419 in early March. Technically, the current gold price is fluctuating between the daily chart of 20SMA (currently around 4643) and 50SMA (currently around 4896), with 50SMA still being an important resistance in the medium to long term. Only by re stabilizing above this line can the gold price challenge the $5000 mark, or even $5419. In the short term, the gold price seems to have stabilized at the Gann 45 degree angle of $4810, and $4860 can be seen as the next resistance, so the possibility of the gold price challenging yesterday's high gradually increases during the day. The above content is for reference only and does not constitute investment advice.
2026-04-15
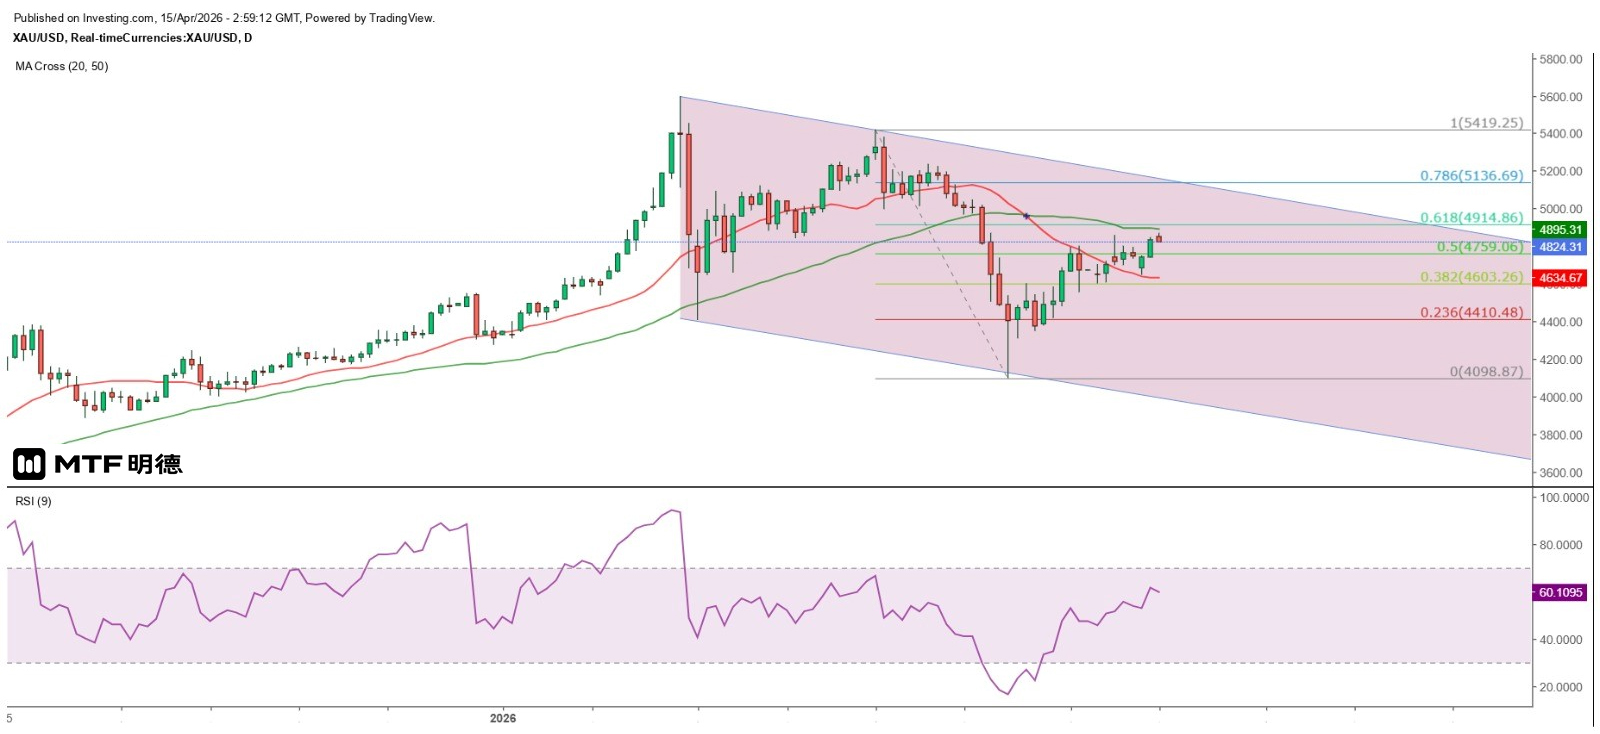
"Gold Price Constrained by 50-Day Moving Average May Resume Downward Trend" 15/4/2026 10:56 Completed After the US military adopted the "anti-blockade" strategy, Trump, in an interview with Fox News, claimed that the war with Iran was coming to an end and that the two sides might resume negotiations within the next two days. In fact, since the US announced that it would blockade all Iranian ports and then entered the Gulf of Oman and the Persian Gulf, and Iran did not carry out the "severe strikes" on military vessels entering the Strait of Hormuz as it had threatened, the outcome was clear and the war between the US and Iran was effectively over! Crude oil and gold prices maintain an inverse relationship. West Texas Intermediate (WTI) crude oil has continued to decline, hitting a low of $90.46 in the early Asian market today. Brent crude oil also dropped to $94.43. It is almost certain that WTI crude oil will eventually return to its original form and fall below $70. As for gold, the spot gold price rose to $4,871.51 in the early morning today, but then dropped sharply. It is likely to form a double top with the high of $4,856 on April 8. Even if the gold price rises further in the next two days, it is expected to peak and fall on Friday. On the contrary, if the gold price fails to break through today's high in the next two days, the downward trend is expected to continue until the beginning of next week. From the daily chart, the gold price is approaching the medium and long-term resistance level of the 50SMA (currently around 4895) further. It is clear that the gold price is no longer in the major bull market of the past year. Since peaking at $5595.46 in January this year, the trend has shown a pattern of each wave being lower than the previous one or approaching a large downward channel. In other words, there is a possibility that the gold price could fall below the March 23 low of $4098.87. Based on the difference between the previous two lows, the gold price may fall to $3792 before a significant rebound. In other words, the gold price is likely to be in a major turning point (downward). The first important support level in the short term is $4660. If this level is breached, it will head towards $4410. The above content is for reference only and does not constitute investment advice.
2026-04-14
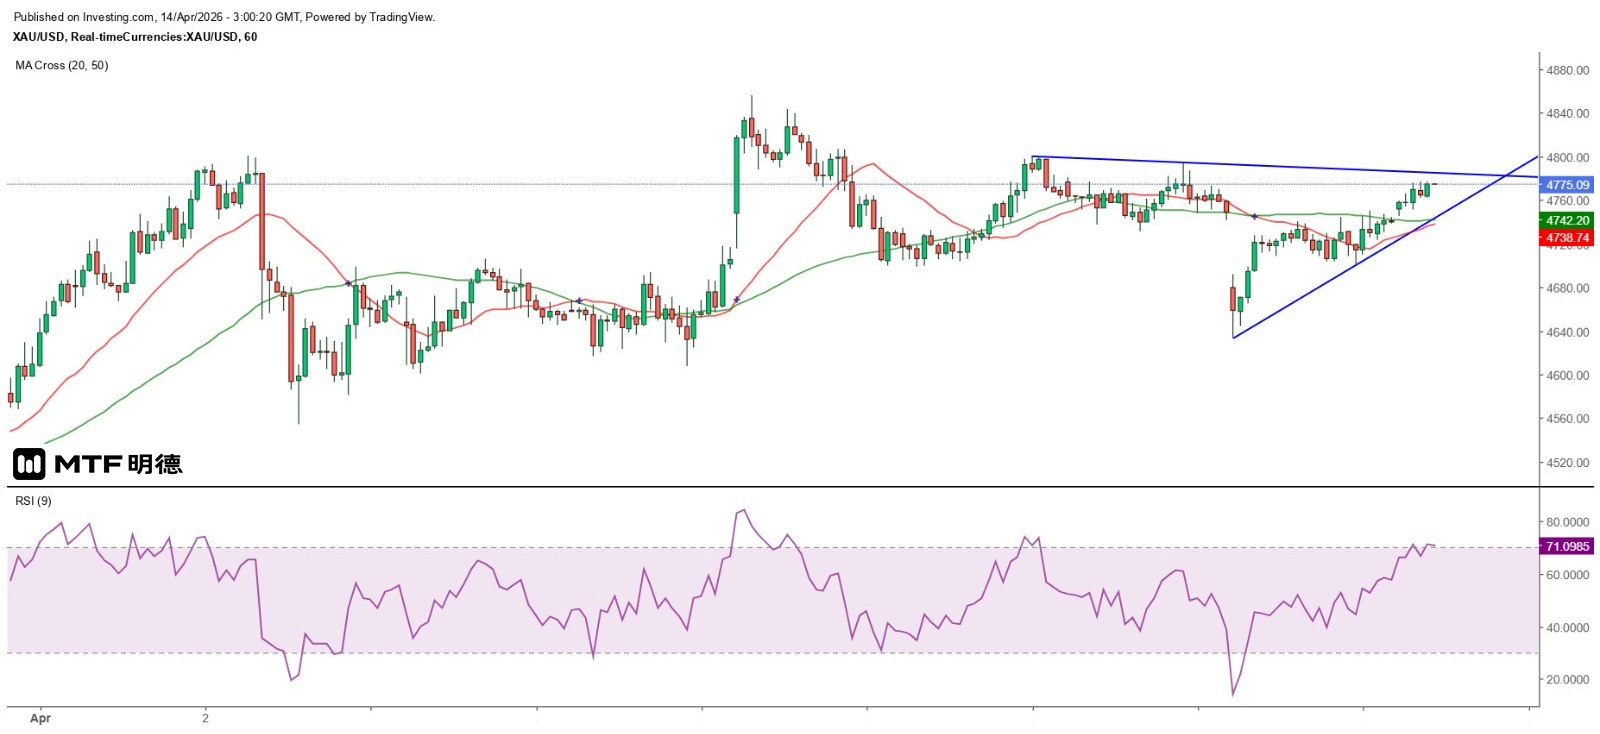
"Gold Price's 50-Day Moving Average Becomes the Next Target for Challenges" 14/4/2026 10:58 Finalized The first round of negotiations between the US and Iran failed, reportedly because Iran only agreed to refrain from enriching uranium for five years and to dilute highly enriched uranium instead of shipping it overseas. The two sides may hold the second round of talks in Islamabad, Pakistan on Thursday. The situation in the Middle East is easing and the war is expected to end. International oil prices have further declined, with New York crude and Brent crude falling back to $97 and $94 respectively. The spot gold price in New York closed the trading session last night by filling the gap left by the decline and rose further this morning, reaching a high of $4,777. From the hourly chart, the gold price peaked at $4,856 on April 8 and has since been in a pattern of each wave being lower than the previous one. The gold price needs to break through $4,795 to break this technical pattern and challenge $4,856. However, from the daily chart, the gold price is currently fluctuating around the 50% retracement level of the largest decline since March 2. The more optimistic view is that the gold price seems to have stabilized at the 20SMA (currently around $4,632), while the 50SMA (currently around $4,897) and the 61.8% retracement level of the aforementioned largest decline at $4,914.86 are expected to be the next major resistance levels. From the perspective of Gann Square, the gold price is expected to remain stable above the strong support level of $4,660. On the upside, it faces two resistance levels: the first is at $4,810, which is at a 45-degree angle, and the second is the strong resistance at $4,960, which is at a 90-degree angle. Additionally, the median of the long-term interest rate target set by the Federal Reserve is 3.1%, meaning that if the federal funds rate is reduced by another 50 basis points to 3% to 3.25%, the target will be reached. If inflation does not fall significantly below 2% but remains stable around 2.5%, the Federal Reserve will have no further incentive to cut interest rates. In the context of high interest rates and gold both being able to hedge against inflation, how will investors make their choices? Therefore, it is boldly predicted that the gold price is likely to fluctuate within the range of $4,000 to $5,000 throughout the year. The above content is for reference only and does not constitute investment advice.
2026-04-13
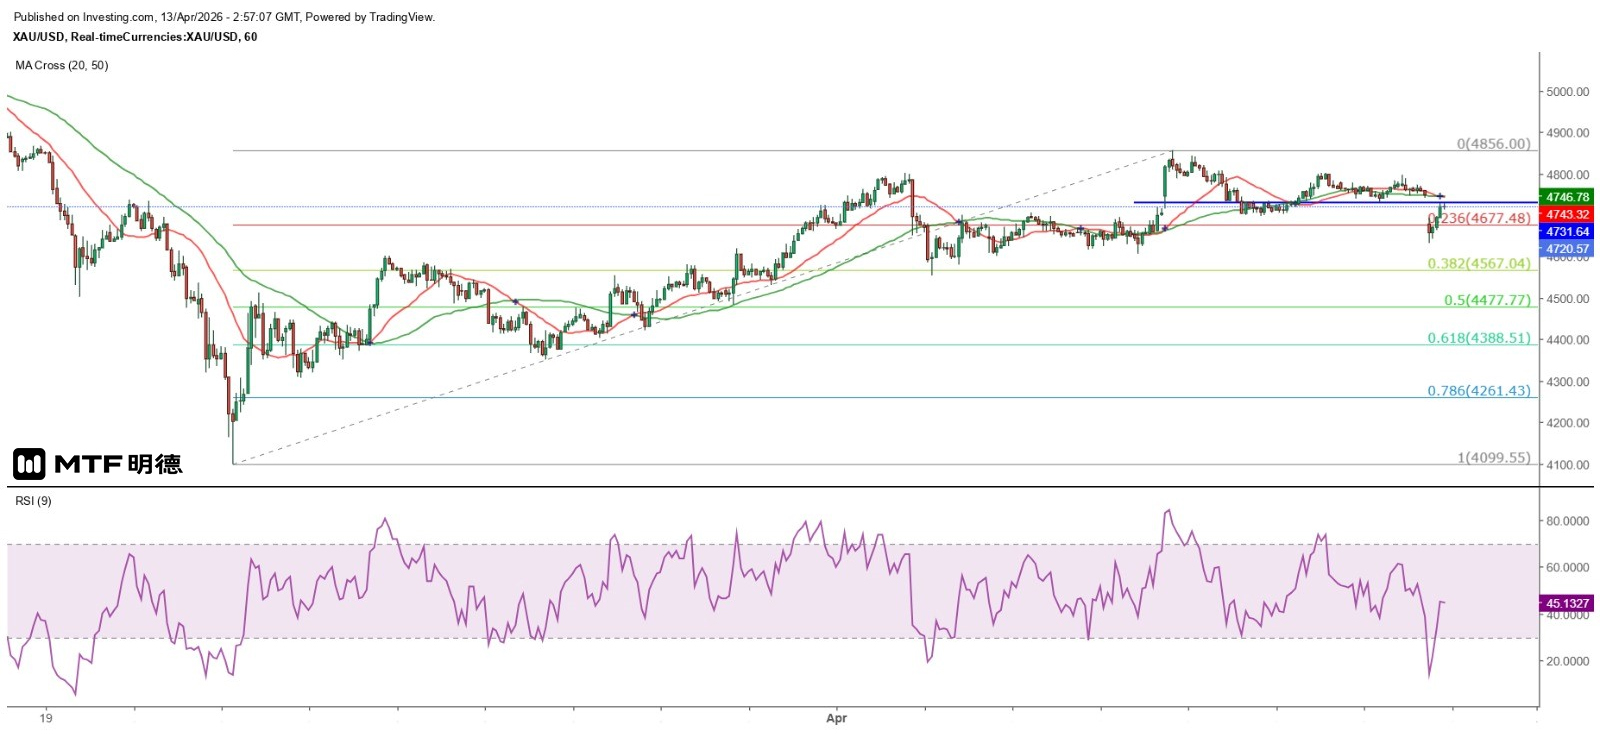
"Gold price is expected to fluctuate below $4,753 within the day" 13/4/2026 10:54 Finalized The US-Iran negotiations ended in failure as expected. It was reported that the two sides failed to reach an agreement on three main issues - the US demanded that Iran share the revenue it earns in the Strait of Hormuz equally (it is unknown whether it is with the US or other affected Middle Eastern countries); the US demanded that Iran hand over all uranium with a concentration of 60% or higher; and Iran cannot enrich uranium for the next 20 years. After the negotiations broke down, the US announced that it would blockade all Iranian ports in the Gulf of Oman and the Persian Gulf starting at 10 p.m. Hong Kong time. Iran has stated that only non-military vessels are allowed to navigate through the Strait of Hormuz. Any military vessel passing through the strait will be regarded as a violation of the ceasefire agreement and will be met with a strong response from the country's navy. As the Strait of Hormuz lies between the Gulf of Oman and the Persian Gulf, US warships must pass through it to enter the Persian Gulf. If the US military proceeds with its plan to enter the Persian Gulf tonight, it is highly likely that a military conflict will break out with the Islamic Revolutionary Guard Corps, and the financial market is expected to be hit again. This morning, the spread of New York crude oil rose sharply, reaching a high of $105. The spot gold price opened lower at $4,671.65, but gradually recouped its losses and has since risen above the $4,700 level, reaching a high of $4,795.77. This reflects market speculation that Trump will once again suspend military operations before the deadline. From the daily chart, the gold price broke through the 20-day SMA ($4,741.5) last Wednesday and has remained above this line since then. The 50-day SMA ($4,900) is now close to the 61.8% retracement level of the decline since March 2nd at $4,914.86, and has become a short-term strong resistance for the gold price. Gold prices are expected to fluctuate within a range of approximately $258 between the 20SMA and 50SMA on the daily chart in the short term. The intraday trend of gold prices has temporarily encountered resistance at the neck line of the small double top at $4731 on the hourly chart, increasing the possibility of gold prices testing the low of $4633.57 again. However, $4660 is a strong support level at the Gann angle, and it is estimated that a small double bottom will form around this level. Before the US military takes action tonight, it is expected that gold prices will fluctuate repeatedly below $4731. The above content is for reference only and does not constitute investment advice.
2026-04-10
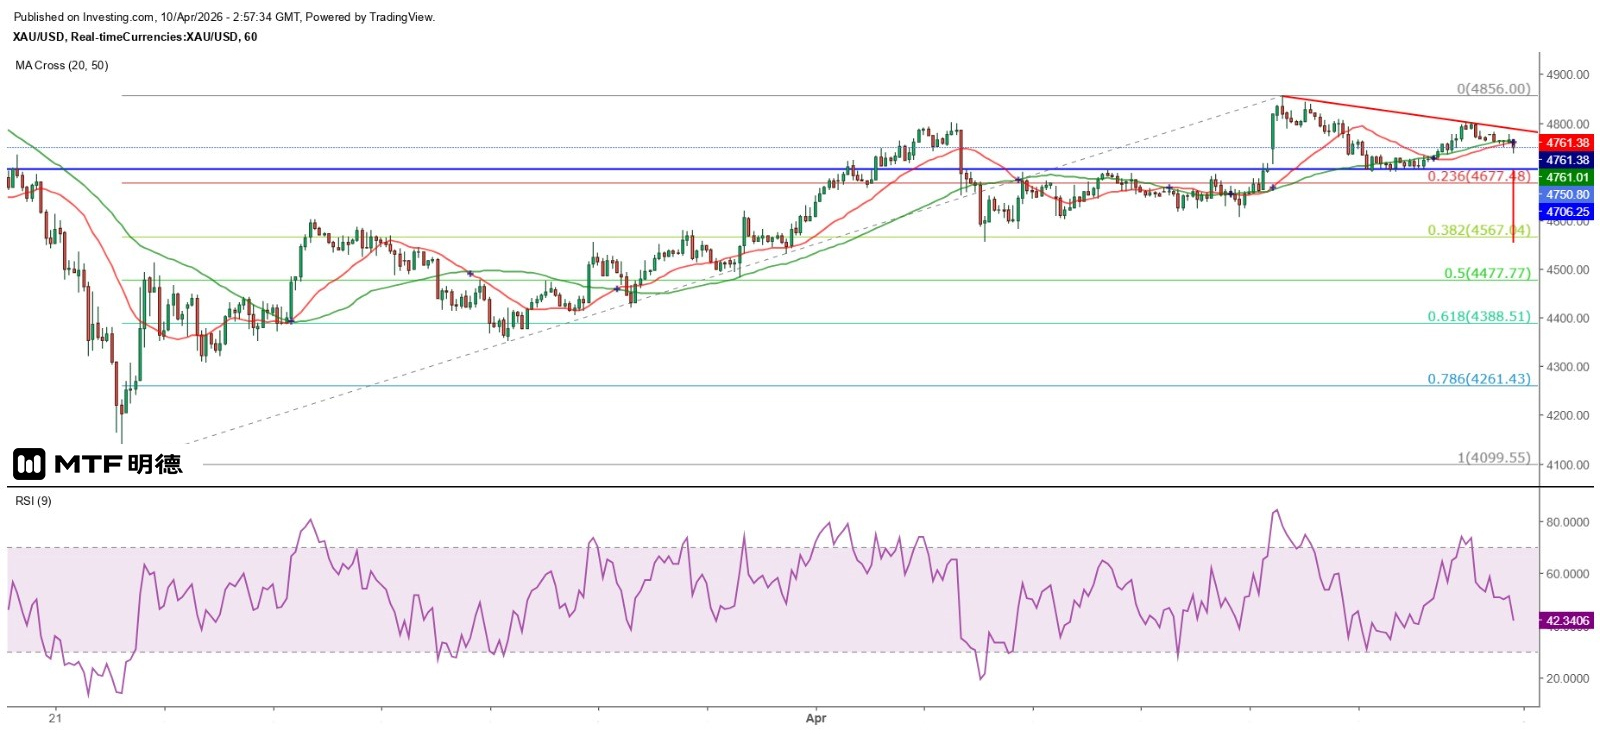
"Gold Price Rally Shows Signs of Weakening" 10/4/2026 10:54 Finalized The United States and Iran plan to hold talks in Islamabad, the capital of Pakistan. It is reported that Iran has emphasized that the ceasefire agreement must include Lebanon. Israeli Prime Minister Netanyahu has also instructed to start direct negotiations with Lebanon as soon as possible, but at the same time made it clear that he would not cease fire in Lebanon until Hezbollah is disarmed. However, the success of the negotiations remains uncertain. In particular, Iran's demand for international acceptance of its uranium enrichment is the main cause of the war. As for charging "toll fees" to ships using the Strait of Hormuz and even turning it into a long-term levy, that is another issue. However, the market's optimism that the US-Iraq war is coming to an end has put pressure on oil prices. The May contract for crude oil in New York was hovering below $99 this morning in the Asian market. Last night, the US announced that the final value of the real GDP growth rate for the fourth quarter was 0.5%, lower than the market's expectations and the initial value of 0.7%, indicating a slowdown in economic growth. The Atlanta Federal Reserve predicted that the GDP growth for the first quarter of this year would only be 1.3%, which is believed to be an excuse for the oil price to fall. In addition, the year-on-year increase in the core PCE in the US in February dropped from 3.1% to 3%, which also became an excuse for the gold price to rise further last night. However, the spot gold price, which had reached a high of $4,801.14, was blocked and fell back, and this morning it was as low as $4,737.96. From the hourly chart, the upward trend of gold prices since March 23rd shows signs of weakening. The pattern of each wave being higher than the previous one may have been broken yesterday. It is expected that the bulls and bears will have a fierce battle at $4,700. Whether it can remain above this level is extremely crucial. In the short term, the trend may develop with $4,700 as a strong support and a flat-bottomed descending triangle. News from the US-Iran negotiations is likely to cause gold prices to fluctuate. If gold prices fall below $4,700 and it turns from support to resistance, the first important support level will be $4,567.04, while $4,800 has clearly become a short-term strong resistance. The above content is for reference only and does not constitute investment advice.
2026-04-09
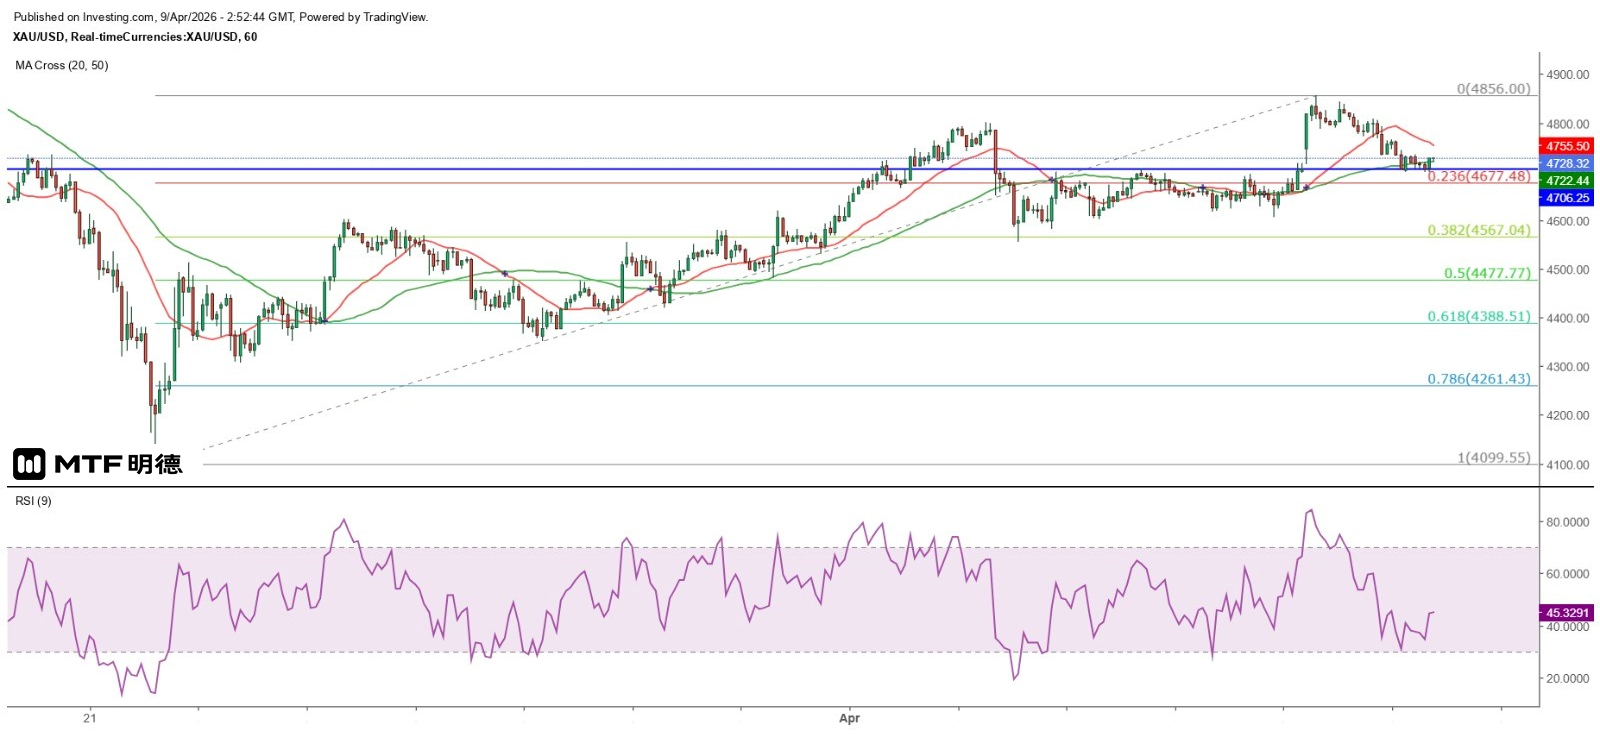
"Gold Price Rebounds but Remains Below 50-Day Moving Average" 9/4/2026 10:43 Finalized Hours after the US and Iran reached a temporary ceasefire agreement, Israel launched an air strike on Lebanon on Wednesday, reportedly killing at least 254 people, the largest since the conflict began. Israel said the temporary ceasefire agreement did not include Lebanon, and US White House Press Secretary Judd Deere pointed out that Lebanon was not included in the agreement and had made it clear to all parties. US Vice President Pence also emphasized in an interview in Budapest on the same day that the US had never promised to include Lebanon in the ceasefire arrangement and said that the relevant claims might be a misunderstanding. Subsequently, many countries issued statements, saying that the temporary ceasefire agreement should include Lebanon in the conflict area. However, Iran then announced the re-blockade of the Strait of Hormuz. The incident led to a further decline in gold prices. Spot gold prices bottomed out at $4,699.65 in the late New York session yesterday before stabilizing. This morning in the early Asian session, although it has regained a foothold above $2,700, it remains in a sideways trend. Technically, gold prices have fully filled the gap from yesterday's rise, and the possibility of a new rise is relatively high. Moreover, the three major U.S. stock indexes still rose significantly yesterday, and although the euro against the U.S. dollar pulled back, it still held onto half of its gains and rose slightly this morning. The market's lukewarm response to Israel's air strikes on Lebanon indicates that investors believe the United States will eventually agree to include Lebanon in the temporary ceasefire agreement, and the Strait of Hormuz will be reopened. As for the gold price, from the hourly chart, it is observed that the gold price has found strong support at around $4,700, which is also the top of the sideways range from April 2nd to 7th. It is believed that this level has become a short-term strong support. From the Gann Square, the larger fluctuation range is expected to be between $4,660 and $4,860, while from the Gann angle, it is between $4,660 and $4,810. Yesterday, the gold price dropped sharply from the high, which is believed to be due to approaching the 50SMA on the daily chart (currently around $4,900). Therefore, even if the gold price rises further in the short term, this line remains a medium-term resistance. Don't forget, the gold price has re-entered a bear market! The above content is for reference only and does not constitute investment advice.
2026-04-08
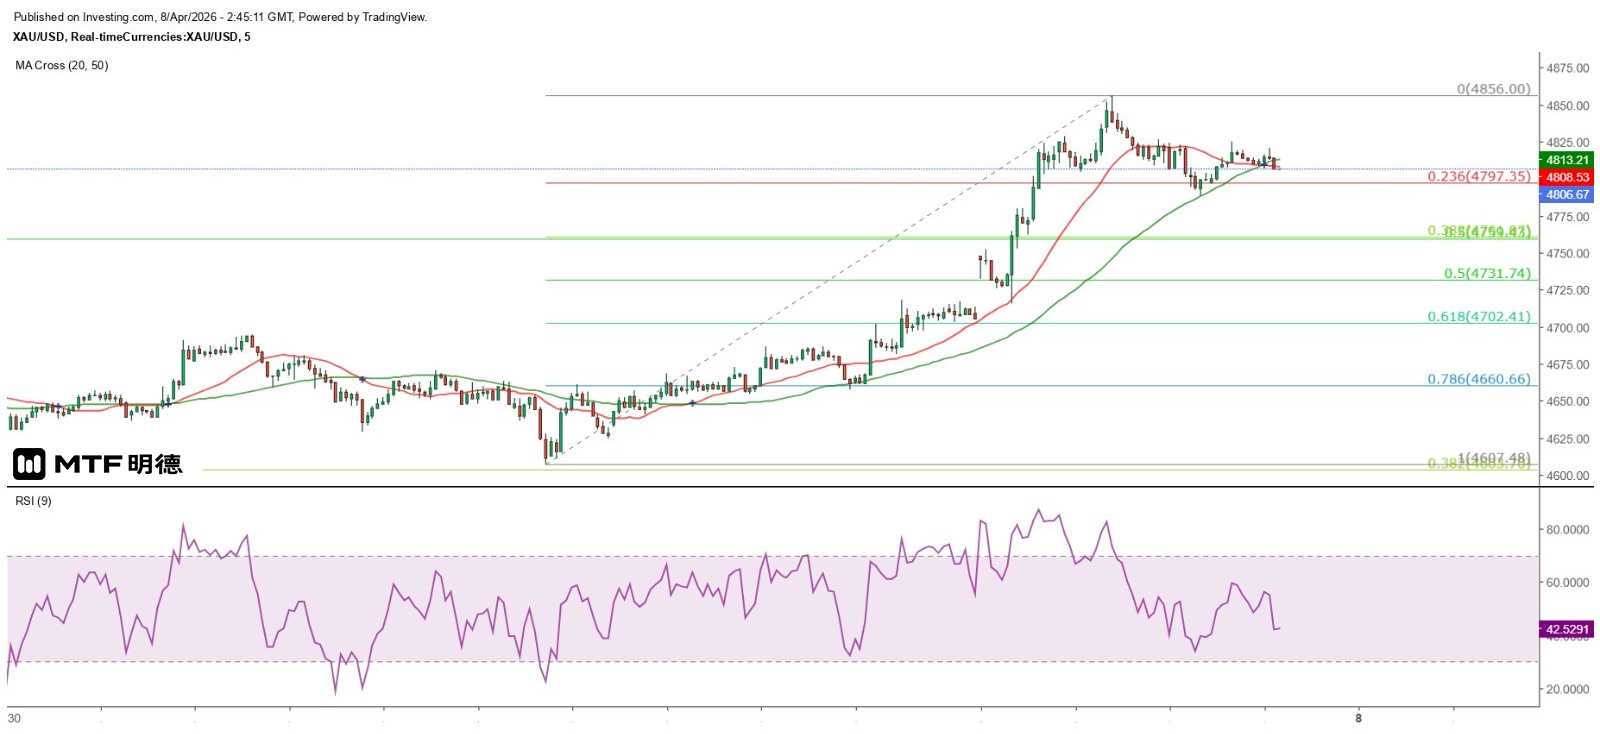
"Gold Price at $4,960 Is Ideal Selling Point" 8/4/2026 10:43 Completed The situation in the Middle East is highly unpredictable, and the financial market has been greatly affected by the remarks. Two days ago, US President Trump said that if Iran did not open the Strait of Hormuz within 48 hours, he would destroy this "civilization". However, two hours before the deadline, Trump said that in response to Pakistan's request and after receiving Iran's ten-point proposal, he believed it could serve as the basis for negotiations, so he agreed to suspend the attack on Iran for two weeks. Iran also stated that during this period, ships using the Strait of Hormuz would be able to pass safely. The news led to a sharp drop in oil prices and a sharp rise in gold prices. The May futures price of oil in New York once fell as low as $91.05 this morning, with a decline of as much as 16.6% from the high of $109.19. It later rebounded but has not yet returned to above $100. The spot price of gold once reached as high as $4,856, with a maximum increase of about 3.2% or more than $150. However, even if the two-week ceasefire can temporarily relieve the pressure on crude oil demand, oil prices may not fall straight down, and gold prices are unlikely to soar. The US-Iran negotiations are doomed to fail. When the pressure on crude oil demand eases, will Trump once again put pressure on Iran? Besides, what exactly are the ten points proposed by Iran? Because according to English and Chinese media reports, there are huge differences in the descriptions of these ten points. Some key points, for instance, accepting Iran's plan to enrich uranium (which is the main reason for the US to attack Iran); lifting the sanctions imposed by the US and other countries on Iran, does this mean lifting the sanctions that have been in place for decades? Also, Iran will charge $2 million from each ship passing through the Strait of Hormuz, but share it equally with Amman to compensate for the losses caused by the war. However, some media reported it as "compensating Iran's losses in full based on the assessment results", which is a world of difference! I think, based on the above suggestions, the negotiations are doomed to fail! Regarding the gold price, first of all, the spot gold price has risen back above $4,800 and has broken through the 45-degree angle of Gann at $4,810. The next major resistance level remains at $4,960. Will the gold price take advantage of the temporary ceasefire to challenge $5,000 and then fall sharply again due to the breakdown of the US-Iran negotiations? It is impossible to say so just based on the point of "accepting Iran's enrichment of uranium". If the gold price really rises to $4,960 at that time, it will be a good time to sell. In the short term, the gold price is expected to fluctuate between the 20SMA ($4,696) and 50SMA ($4,918) on the daily chart. In terms of the intraday trend, the 50SMA ($4,811) on the 5-minute chart is extremely crucial. Once it is broken, the gold price is expected to decline further, with the first important support at $4,731. The above content is for reference only and does not constitute investment advice.
2026-04-02
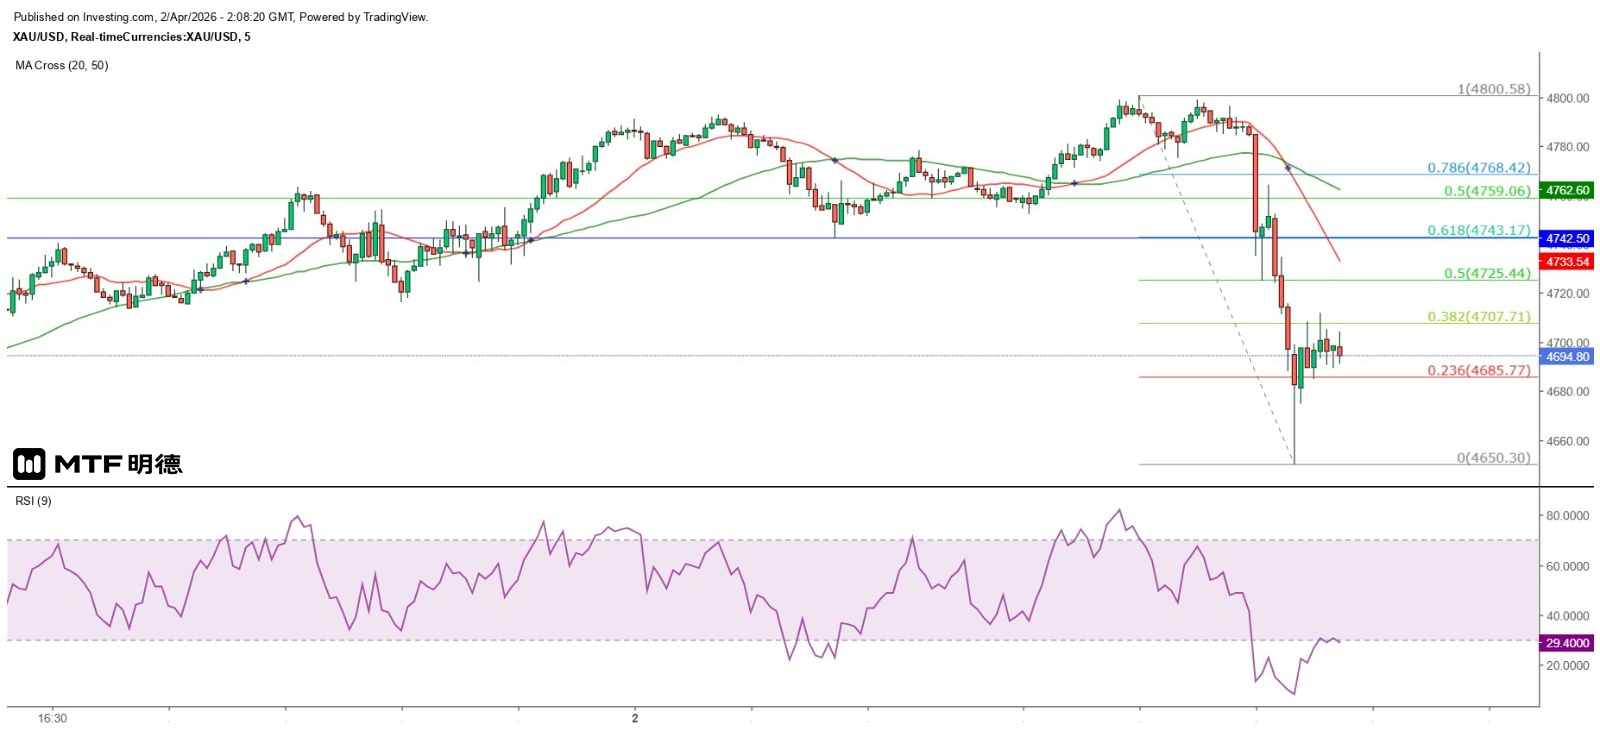
"Gold Price Expected to Reach $4,960 Before Stopping" 2/4/2026 10:04 Finalized US President Trump made a national address during the Asian morning market, causing a sharp rise in international oil prices and a sharp fall in gold prices. Although he said that the United States does not need oil from the Middle East, and those countries that need to obtain oil through the Strait of Hormuz must be responsible for maintaining this waterway, it is believed that the rapid reversal of oil and gold prices was due to his statement that the US military operation against Iran would last for two to three weeks, and if no agreement is reached, it would strike Iran's energy facilities. Influenced by his remarks, both WTI crude oil and Brent crude oil have risen back above the $100 level, but the gap between the two has narrowed to less than $2. Spot gold prices rose to a high of $4,800.58 in the Asian market this morning before falling back, hitting a low of $4,650.3. This is in line with my view yesterday that gold prices are approaching a short-term strong resistance level. The $4,650 level has slightly broken through the strong support level of $4,660 at the Gann level angle. In comparison, the $4,810 resistance is weaker, while the $4,660 support is stronger. In other words, gold prices still tend to rise further until they approach or reach the strong resistance level of $4,960 at the Gann 90-degree angle. From different timeframes, gold prices have been supported and met resistance at various moving averages. As seen on the hourly chart, after testing the 20SMA (currently around 4751.5), the price rebounded strongly. On the 1-minute chart, the price has regained its footing above the 20SMA (4697) and has even challenged the 50SMA (4709). Therefore, it is expected that the 50SMA will be broken through within the day, with the major resistance seen at $4742.5. From the daily chart, today's high has broken through the 20SMA (4783.8), suggesting that in the short term, the price will likely remain above the 20-day SMA or $4810 (with a high chance of breaking through after consolidation), while the 20SMA on the hourly chart or $4660 will serve as strong support. In summary, gold prices are expected to fluctuate within the range of $4660 to $4810 in the short term. The above content is for reference only and does not constitute investment advice.
2026-04-01
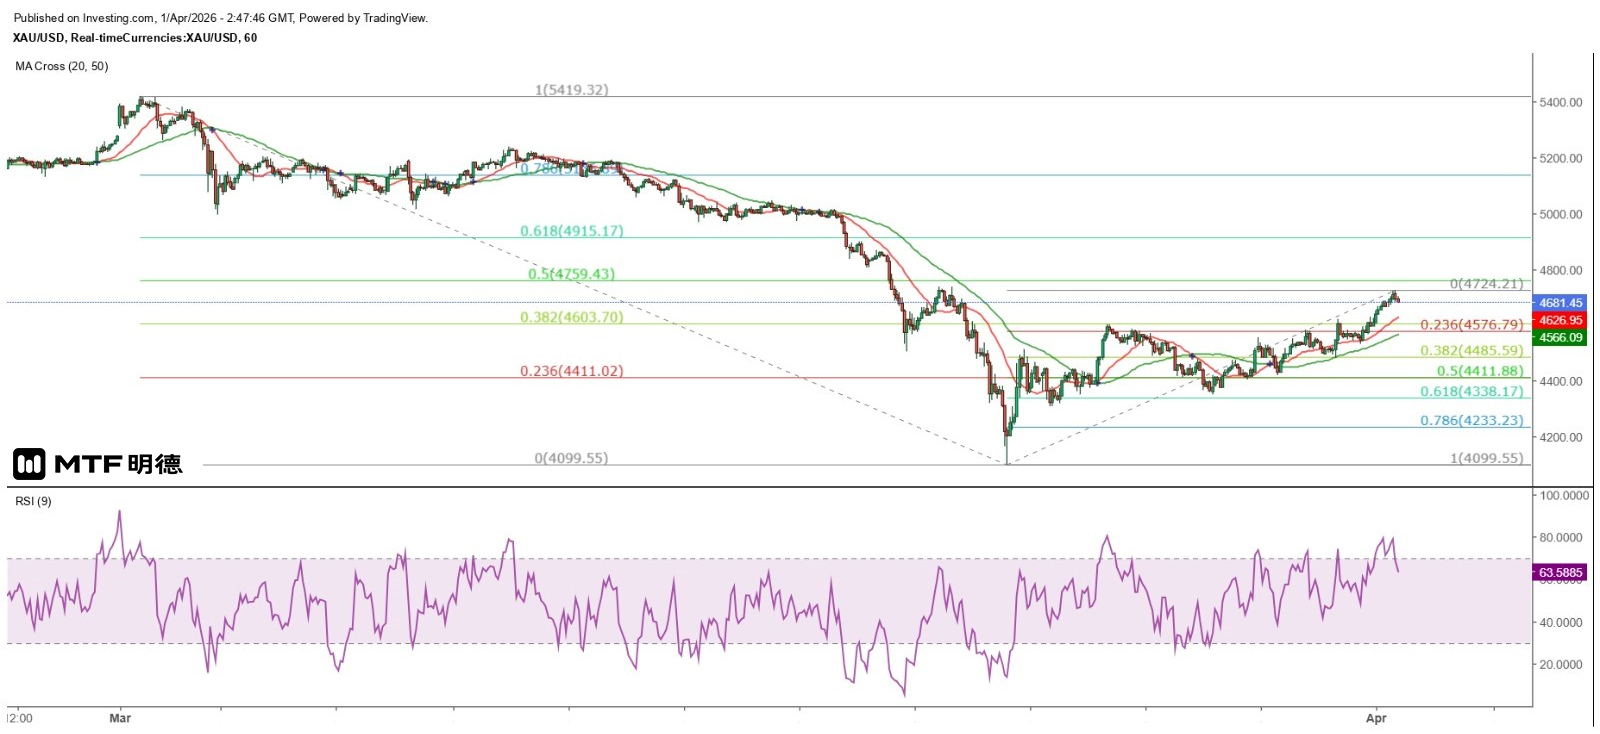
"Gold Price Expected to Fluctuate Above $4,600" 1/4/2026 10:45 Completed US President Trump said that the US has achieved the goal of weakening Iran's military strike capabilities and the war can end without an agreement between Iran and the US. Regarding the Strait of Hormuz, he said that whoever uses it should be responsible for its security and it is impossible for the US to be involved for a long time. Despite this, the US and Iran are still attacking each other. The Revolutionary Guards of Iran warned on Tuesday that from 8 p.m. Tehran time on Wednesday, 18 US companies would be targeted, including Microsoft, Google, Apple, Intel, IBM, Tesla and Boeing. The financial market responded positively. The three major US stock indices rose sharply last night. The Nasdaq Composite Index jumped nearly 796 points, or over 3.8%, the S&P 500 rose nearly 185 points, or over 2.9%, and the Dow Jones Industrial Average also climbed over 1,125 points, or nearly 2.5%. With the inverse relationship between oil and gold persisting, the gold price broke through the psychological resistance of $4,600. The spot gold price reached as high as $4,724.21 this morning, approaching the 50% retracement level of the biggest decline since March 2nd, which is $4,759.43. The next level is at the 45-degree angle of Gann's theory at $4,810. In other words, the gold price is approaching a short-term strong resistance. As the spot gold price rose by only over 40 dollars this morning, which is less than the normal range of 50 to 80 dollars, there is still a chance for it to challenge 4759.43 dollars within the day. However, it should be noted that the spot gold price has shown a long bearish candle with a lower high and lower low on the hourly chart. Therefore, before the price breaks through 4724.21 dollars, the possibility of further correction is relatively high. The 50SMA on the hourly chart (currently around 4572.5) can be regarded as a strong support level. However, due to the imminent end of the US-Iran conflict, a correction to the 20SMA (currently around 4633) will have strong support, and the previous strong resistance at 4600 dollars has now become a strong support. It is expected that the price will fluctuate above 4600 dollars in the short term. Currently, the 50SMA on the daily chart has dropped to around 4954 dollars, which is very close to the 90-degree angle of Gann at 4960 dollars, indicating that this level will be the ultimate resistance for the current rebound wave of the gold price. The above content is for reference only and does not constitute investment advice.
2026-03-31
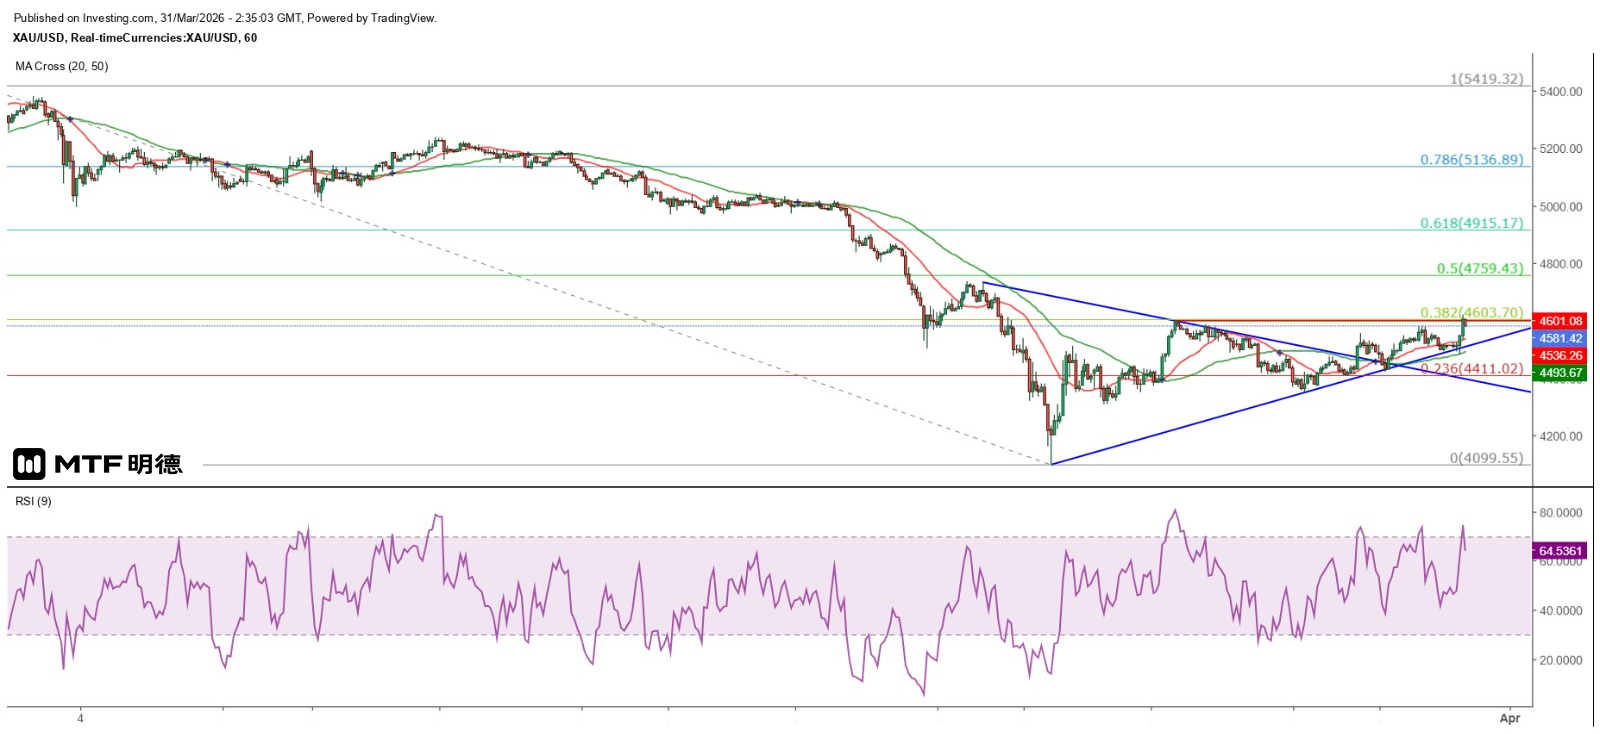
"Gold Price Expected to Test $4,660 Intraday" 31/3/2026 10:33 Finalized International oil and gold prices witnessed a dramatic reversal in the early Asian market today. After reaching a high of $106.82, New York crude oil dropped rapidly to a low of $100.88. Similarly, Brent crude oil, which had peaked at $109.99, plunged sharply to a low of $104.76. Gold prices continued their recent inverse relationship with oil prices, surging as oil prices plummeted. From the hourly chart, gold prices bottomed out at $4,482.88 this morning and closed at $4,547.61 after a bullish engulfing pattern, and then rose further, reaching a high of $4,619.14. The oil and gold prices suddenly reversed, mainly due to Trump's remarks. According to The Wall Street Journal, citing US government officials, Trump told his staff that even if the Strait of Hormuz remained largely closed, he was still willing to end the US military operation against Iran. However, this message was conveyed through a third party, which might be an attempt to test whether Iran would reach an agreement with the US as a result, or it could be another false message to lull the Iranian military into a false sense of security before launching a large-scale attack. Besides, Trump had pointed out not long ago that the US had sufficient crude oil, and it was Japan, South Korea, China and Europe that needed to import crude oil through the Strait of Hormuz. The blockade of the strait by Iran had no impact on the US. So why should the US alone maintain the waterway? Let's see how the situation between the US and Iran develops! This morning, the spot gold price rose to the 38.2% retracement level of its biggest decline since March 2nd (3603.7), but was again blocked. It then gradually fell back to the $4,580 level. From the hourly chart, it can be seen that the gold price has broken through the narrowing triangle, and the adjustments last night and this morning have also held above the extension line of the ascending track of the triangle. Therefore, it is expected that the gold price has a high chance of breaking through $4,600 within the day and challenging the strong resistance at $4,660, which is at the level angle of the Gann Square. If the situation develops favorably, it may even further challenge the $4,810 level at the 45-degree angle. The above content is for reference only and does not constitute investment advice.
2026-03-30
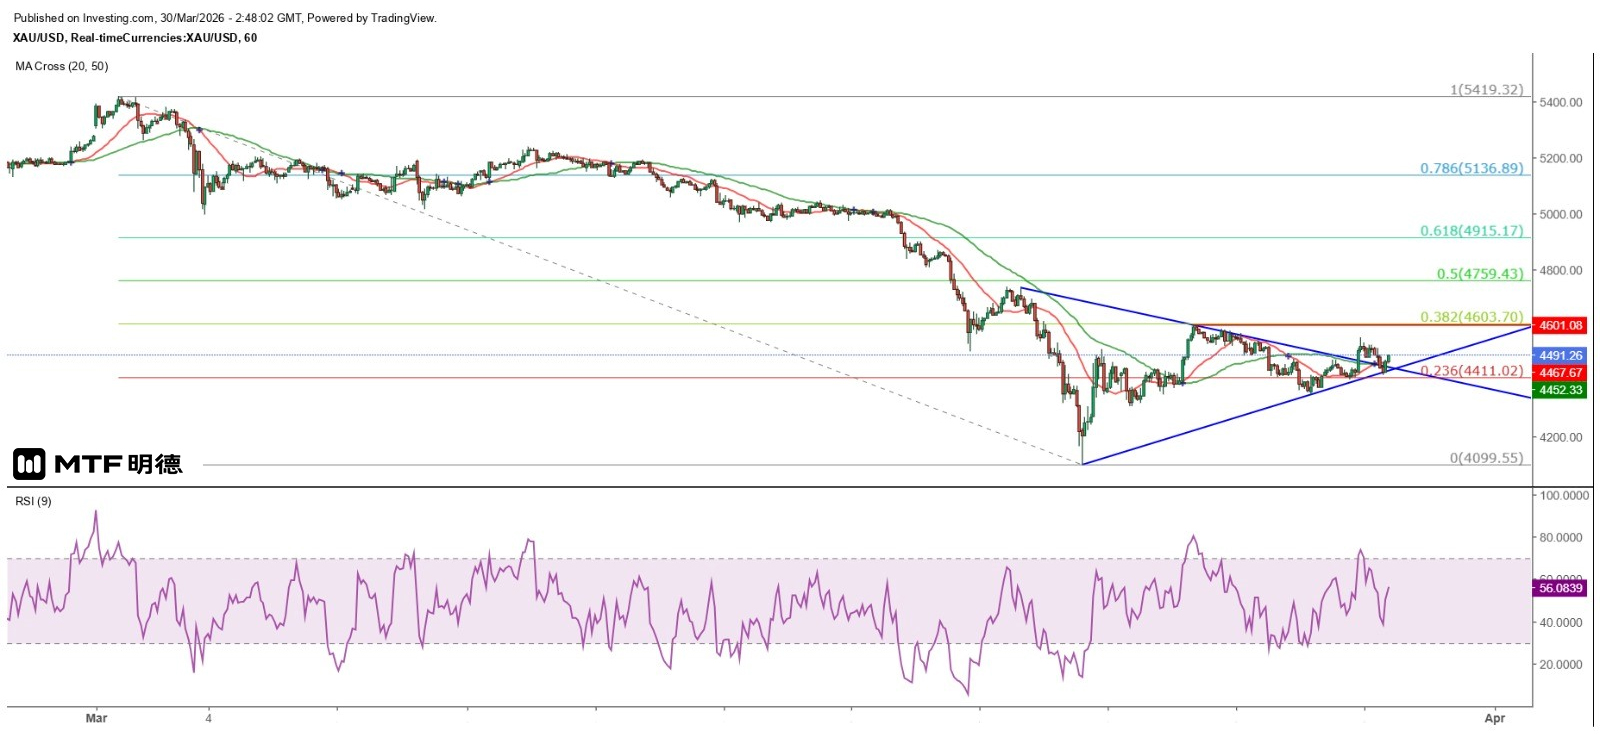
"Gold Prices Have a High Chance of Repeatedly Rising This Week" 30/3/2026 10:45 Completed International oil and gold prices continue to be affected by the geopolitical conflicts in the Middle East. The main reasons are concerns over disruptions in crude oil supply, rising inflation expectations and growing risk aversion. Currently, New York crude oil has risen back above the $100 per barrel level, and Brent crude oil has also risen above $110 per barrel. Although Iran has opened the Strait of Hormuz to oil tankers from about 20 countries, there are still no signs of a short-term ceasefire between the US, Israel and Iran. Moreover, US President Trump said that there are still 3,000 Iranian targets that have not been attacked, and the US military continues to increase its troops in the Middle East. The peak of the Middle East conflict has not yet arrived. Last Friday, the spot gold price once rose to $4,555.41, up more than $200 from the low of Thursday's New York session. However, it continued to fall after the London close and closed below $4,500. This morning in the early Asian session, the gold price dropped to $4,420.48 before climbing again. From the hourly chart, it can be seen that although the adjustment this morning briefly broke through the low of the large bullish candle in the early New York session last Friday at $4,431.04, it eventually closed above that level, which can be regarded as an important support level for the day. In addition, last Friday, the gold price slightly broke through the resistance of the narrowing triangle's descending track, but it still needs to rise above $4,601.08 to have the potential for further gains. This is the 38.2% retracement level of the biggest decline since March 2nd, and it remains a strong resistance for the gold price in the short term. Whether it can break through this level is the key to the gold price's future trend. From the perspective of Gann's Square, $4,410 still provides strong support, while the resistance level is at $4,510. If it breaks through, $4,579.43 will be a strong resistance. From the analysis of the short-term cyclical trend, the gold price is expected to rise and fall repeatedly this week. However, if it falls below last Friday's low of $4,351.16, regardless of whether it closes below this level or not, it is expected that the gold price will bottom out and rebound on Tuesday or Thursday of this week. A break below the ascending track on the hourly chart will be regarded as a warning of further decline. The above content is for reference only and does not constitute investment advice.
2026-03-27
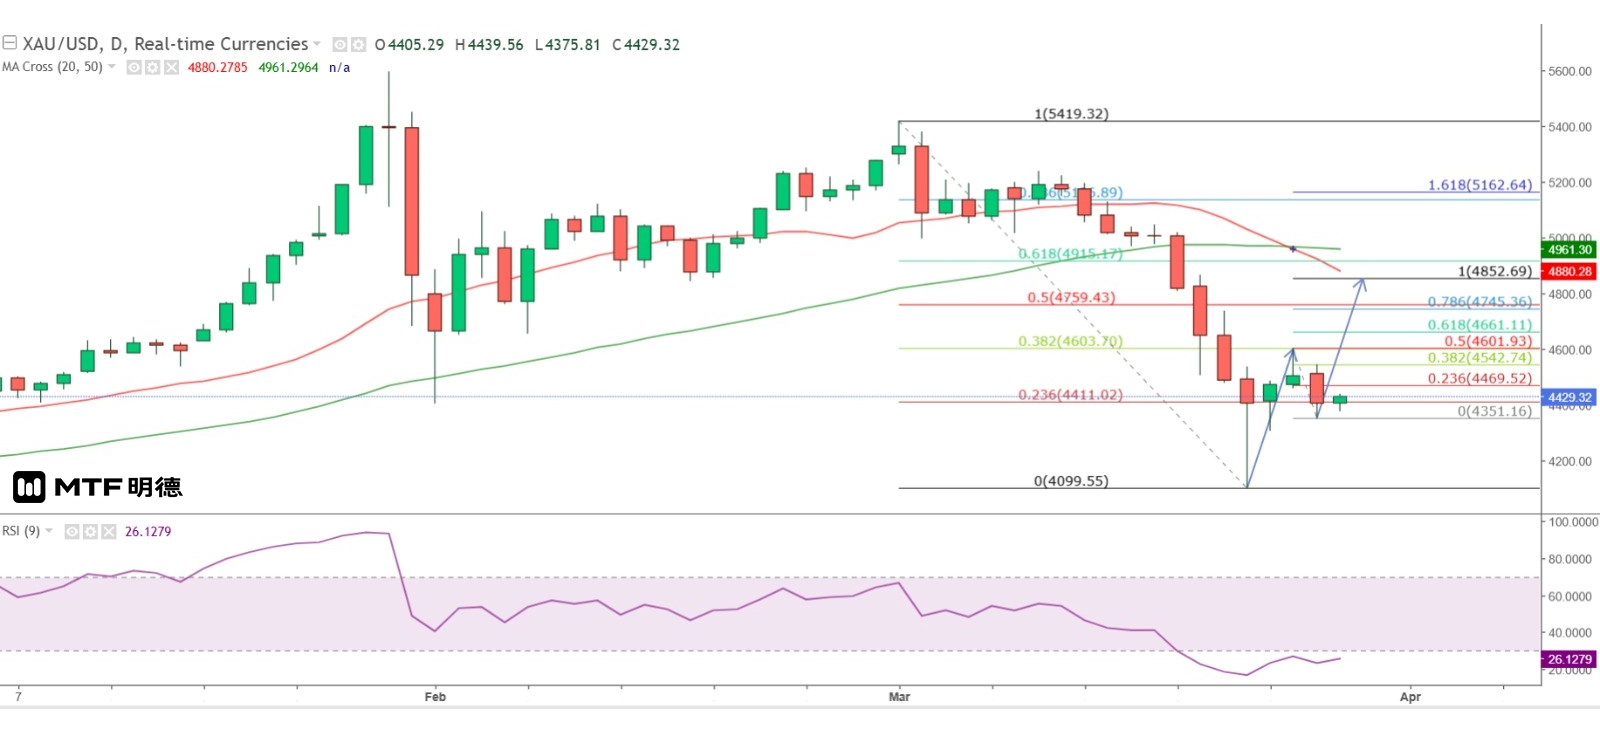
"Gold's Rebound Wave May End Early Next Week" 27/3/2026 10:39 Completed The situation in the Middle East remains a market focus. US President Trump said that the time for the US to launch air strikes on Iran's energy facilities would be postponed by 10 days. Meanwhile, the US Department of Defense said it was considering sending an additional 10,000 ground troops to the Middle East, thus providing Trump with more military options. It is obvious that the US is trying to pressure Iran into reaching an agreement that the US wants. International oil prices plunged sharply in the late trading session in New York yesterday. West Texas Intermediate (WTI) crude oil once dropped to $89.51, while Brent crude oil fell to $97.11. However, they gradually recovered their losses. This morning, WTI crude oil rose to around $94, and Brent crude oil climbed to $101. As for the performance of gold prices, it was mentioned yesterday that if the spot gold price fell to around $4,350.89, it would be a buying opportunity. Indeed, the spot gold price dropped to $4,351.16 in the late trading session in New York yesterday and then rebounded. This morning, it rose above $4,400 and further strengthened to $4,439.56. Measuring the movement since March 23rd with the Fibonacci extension lines, if the new extension reaches 100%, the gold price will rise to $4,852.69, which will simultaneously break through the 50% retracement level of the largest decline since March 2nd at $4,759.43. From the daily chart, it can be seen that the 20SMA (currently around $4,880) is still gradually moving down and further away from the 50SMA. The 20SMA is likely to touch $4,852.69 on Monday or Tuesday, and the gold price's rebound wave may temporarily end. In other words, $5,000 will be a strong resistance for the gold price in the medium term, and $4,660 at the Gann level angle will become an important support at that time. Currently, the ultimate support is $4,350, and $4,410 at the Gann 270-degree vertical angle is a strong support. The above content is for reference only and does not constitute investment advice.
2026-03-26
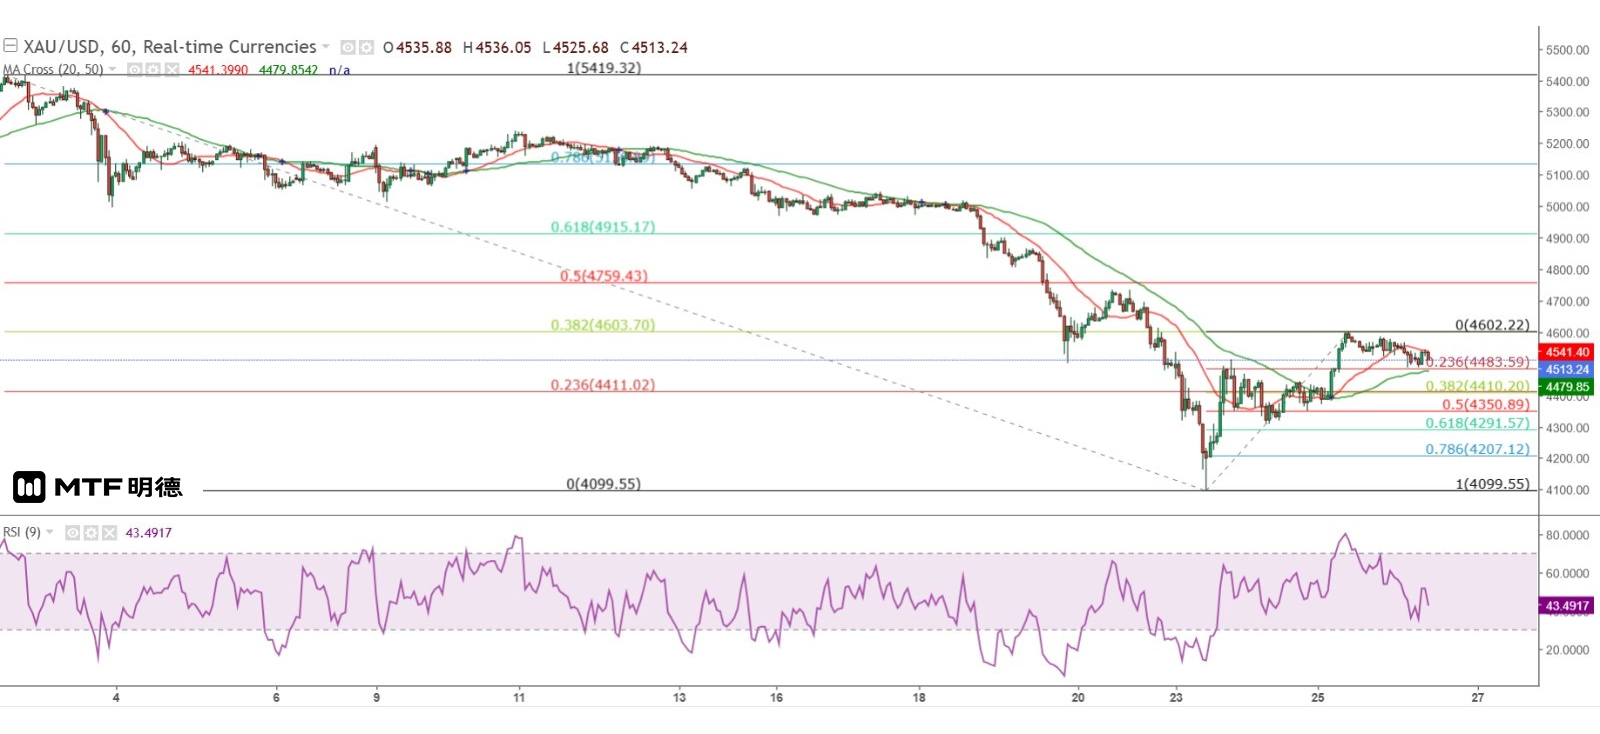
Gold prices have been slowly rising, but after reaching a high of $4,552.45 in early trading in Tokyo yesterday, they failed to set a new intraday high in Europe and New York City. The trend has been consolidating with a gradual downward movement, similar to the trend that began in New York City on Monday. If the current pattern continues, the low adjustment level seen at the end of yesterday's trading in New York City should not be breached, and there is a greater chance that gold prices will challenge the Gann horizontal angle of $4,660 intraday. Regarding market news, the "Xi-Trump meeting" has been scheduled for May 14-15. However, it remains to be seen whether the United States will launch a large-scale military operation against Iran before then, or whether it will take action only during the visit to China. Logically, Trump should avoid escalating the military conflict between the United States and Iran before then. Additionally, the European Union and some non-EU American allies, such as Japan and South Korea, have agreed to jointly maintain the safety of the shipping lanes in the Strait of Hormuz (possibly reaching some level of agreement with Iran to avoid attacks). The United States can temporarily step back from the front line, but as pointed out yesterday, is this a delaying tactic by the United States? Therefore, before Easter, the related risks still exist. The gradual increase in gold prices reflects the market's caution. Currently, gold prices are still constrained by the rebound level of 38.2% (4603.7), which is the largest decline since March 2nd. If gold prices fail to break through this level in the short term, or encounter significant selling pressure near $4,600, or form a double top near this level, further downward testing to $4,400 should be guarded against. However, if gold prices retest the maximum increase of 50% since this week, near $4,350.89, in the next two days, it can be considered a buying opportunity. For further upward movement in the future, $4,660 is an important hurdle that must be breached. The above content is for reference only and does not constitute investment advice.
2026-03-25
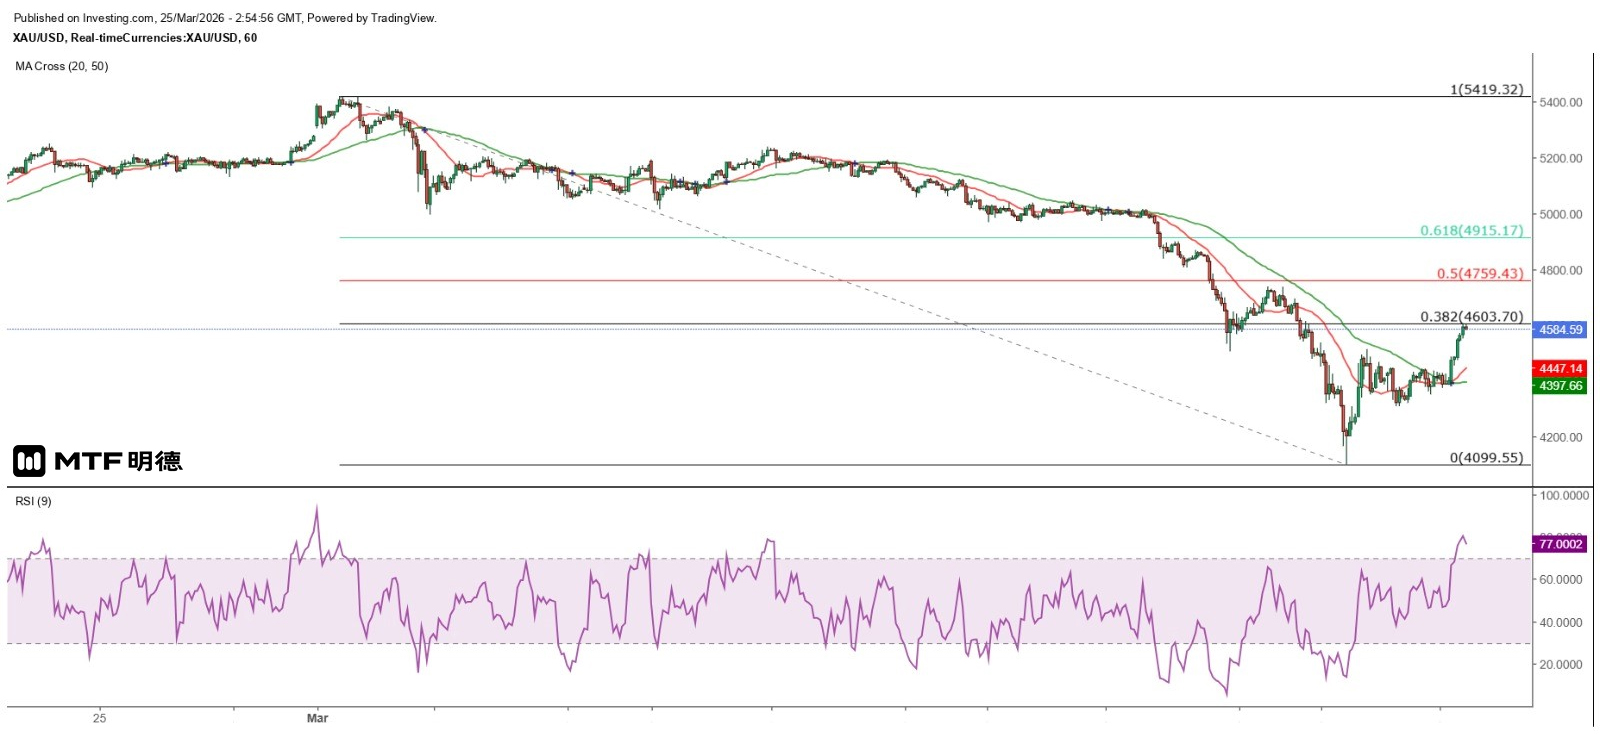
"Gold Price Short-Term Rebound Faces Resistance at $4,660" 25/3/2026 10:53 Completed Gold prices have continued to rebound. After forming a triangle on the hourly chart, spot gold prices broke upward through the 50SMA (currently around 4397) in the late New York trading session yesterday. This morning, it rose to 4601.08 US dollars, just over a hundred dollars away from the 4720.17 US dollars indicated by the 100% Fibonacci extension level mentioned yesterday. Additionally, gold prices have also surpassed the previous low of 4503.47 US dollars set on March 19th, thus breaking the downward trend on the hourly chart. On the other hand, this morning's high in gold prices approached the 38.2% retracement level of the biggest decline since March 2nd at $4,603.70, which can be regarded as the first significant resistance for this rebound wave. The subsequent important resistance level is the Gann angle at $4,660. Once this level is firmly held, gold prices may further challenge the aforementioned $4,720.17 and $4,759.43 (the 50% retracement level of the biggest increase since March 2nd). The US-Iran conflict remains a major risk factor. Although Trump said that the attack on Iran's power plants and energy facilities would be postponed for five days, some analysts believe that this might be a delaying tactic. The US military is using this five-day period to deploy and occupy the Revolutionary Guard's Hormuz Island. If it is captured, Iran will be in a passive position. Moreover, NATO has also expressed its stance, supporting Trump's military actions against Iran. NATO Secretary-General Mark Rutte said that since March 19, 22 countries (mostly NATO members) have responded to Trump's call to ensure the safety of navigation in the Strait of Hormuz. As such, the ultimate outcome will be a sharp drop in oil prices, while gold prices may surge sharply (if still moving in the opposite direction of oil prices). As for why gold prices fall when oil prices rise, although it is said that funds flow from the gold market to the oil market, what is the underlying logic? It is very simple. International crude oil is priced in US dollars. A large demand for crude oil means a large demand for the US dollar. When the US dollar rises, gold prices naturally fall! In the short term, since the gold price rebound has just begun, any pullback will be regarded as a buying opportunity. However, from the daily chart, the 20SMA (currently around 4966) has fallen below the 50SMA (4970), indicating that the gold price rally that began in August last year has ended. It is expected that 4960 US dollars (Gann 90-degree angle) will be the ultimate resistance level for this round of gold price rebound. The above content is for reference only and does not constitute investment advice.
2026-03-24
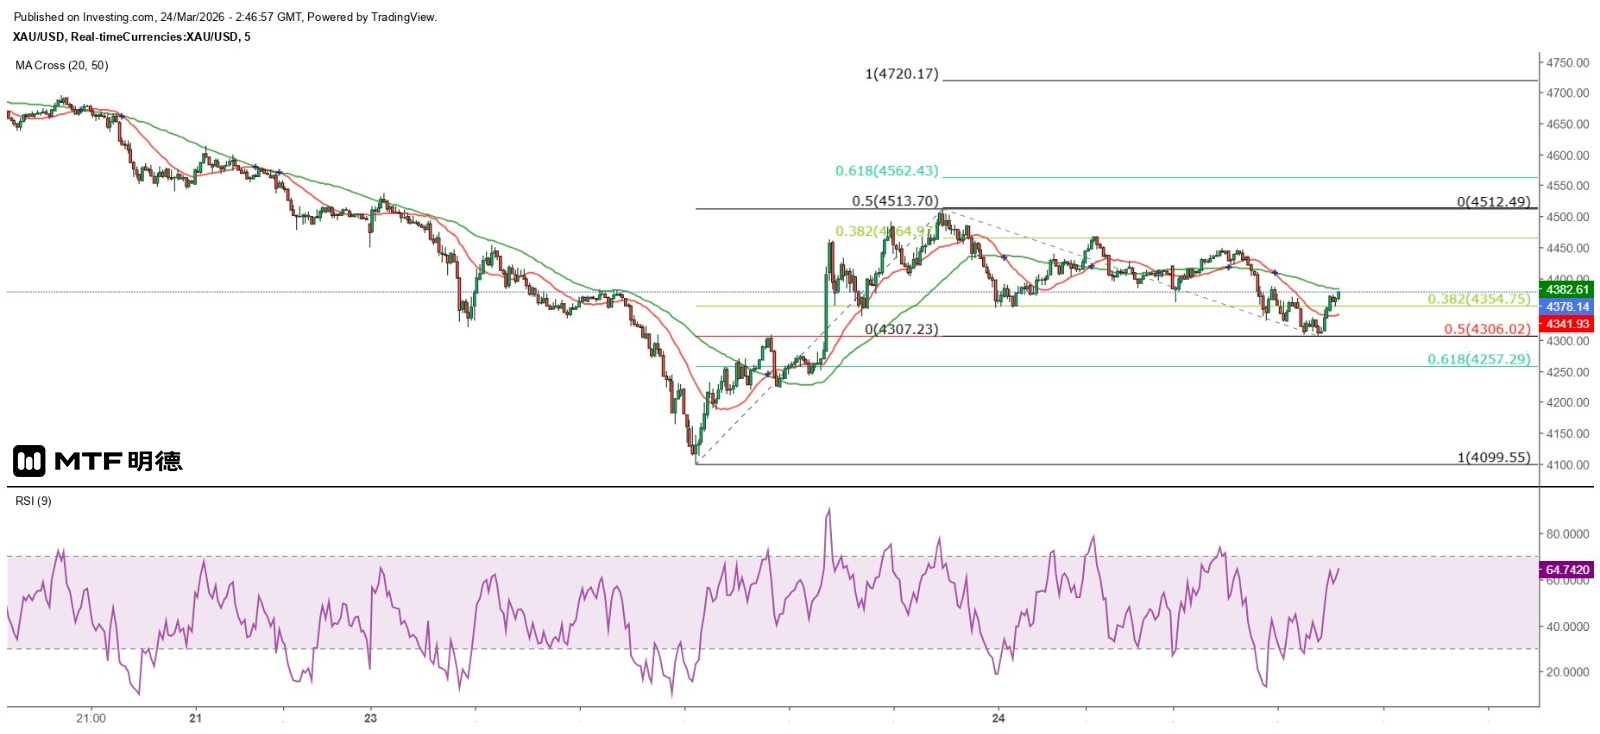
"Gold Price Rebound Wave Could Reach $4,759" 24/3/2026 10:45 Completed Trump's sudden policy shift towards Iran, postponing the plan to attack Iran's power plants and energy facilities for five days and indicating that the US and Iran might reach an agreement, led to a sharp drop in oil prices and a significant rebound in gold prices. Spot gold prices hit a low of $4,099.55 and then continued to rise, reaching a high of $4,512.49, but then fell again, approaching $4,300 in the early Asian market today. It was pointed out yesterday that investors should wait for gold prices to stabilize above the 50SMA on the 5-minute chart (currently around 4387) before making a purchase. The gold price broke through this line near the midday of Europe yesterday, and after briefly dipping below it, it held above it again. Before the opening of the New York market, it rose sharply to 4462.65 US dollars, and then rose repeatedly along the 50SMA, reaching a high of 4512.49 US dollars before encountering resistance and falling back. In fact, making profits in the gold market is not as difficult as imagined. This is because its trends follow certain patterns and do not require too many operational skills. Just referring to the moving average lines is enough to make profits. What are they? According to my observation, operating with the 20 and 50 SMA on 1 and 5-minute charts can yield a success rate of up to 80%, while the 20 and 50 SMA on the 1-hour chart can be used to determine whether the gold price is turning. Investors should note that moving average lines only work in clear upward or downward trends. If you use moving average lines in a sideways market, it is certain to cause you to blow up your account! As of now, the rebound in spot gold prices is still some distance away from the 50SMA on the hourly chart (4486). A break above and sustained hold above this line would be necessary to consider a long position. However, as mentioned yesterday, gold prices have reached the 100% Fibonacci extension of the decline, indicating a high probability of a short-term rebound. Indeed, gold prices have rebounded by more than $400 from the low, but does this suggest that the upward momentum is waning? From the 5-minute chart, it can be seen that the low point of the adjustment this morning at $4307.23 is very close to the 50% retracement of the largest rebound since yesterday's low ($4306.02). This suggests that the rebound in gold prices has not yet ended. If it reaches the 100% Fibonacci extension, gold prices would have to rise to $4720.17 before encountering significant selling pressure. If the short-term trend continues to decline and tests the previous low of $4099.55, it could also form a double bottom pattern and rebound. The entire rebound wave in gold prices is expected to end around $4759. The above content is for reference only and does not constitute investment advice.
2026-03-23
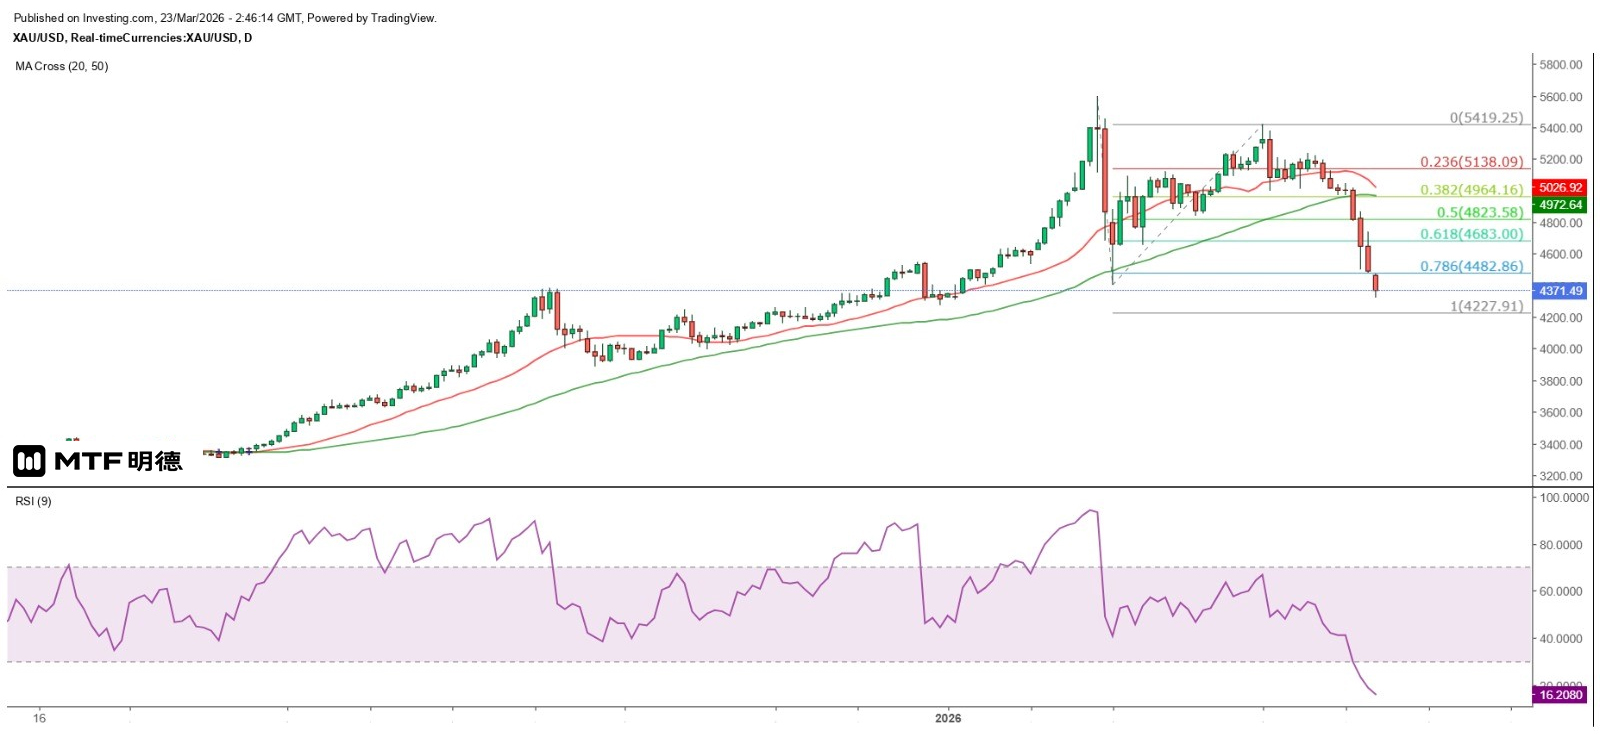
"Gold Price Enters Technical Bear Market" 23/3/2026 10:44 Completed After the gold price broke through the 50-day simple moving average (SMA) on the daily chart last Wednesday (currently around 4973), it showed no rebound strength and the decline intensified. The spot gold price further dropped to 4320.19 US dollars in the early Asian session today. Moreover, since the peak of 5595.46 US dollars on January 29 this year, the gold price has fallen by approximately 22.8% so far, meaning that it has entered a technical bear market. Measured by the Fibonacci extension line, 4227.91 US dollars represents the 100% extension of the decline on the daily chart and can be regarded as a short-term strong support level for the time being. However, historical data shows that during the past five bear markets of gold prices, the shortest duration was 21 months and the longest was 142 months, with declines ranging from 43% to 57%. This current bear market began in January this year and has not yet reached two months, with the maximum decline being 22.8%. If the decline reaches 43%, the gold price will fall to $3,189.4. From the Gann Square perspective, $4,410 is located at the 270-degree vertical angle, which is considered a strong support (or resistance). Currently, the gold price has fallen below this level, and the 9RSI on the daily chart has dropped to 17, indicating that the gold price is in a severely oversold state and could rebound at any time due to overselling. However, $4,660 at the horizontal angle is a strong resistance. In the short term, the rebound of the spot gold price's downward trend is still constrained by the 50SMA on the 5-minute chart (currently around 4438.6). Investors should wait for a clear break above this line before deploying a buy position. Even using the candlestick chart as a reference, it is not advisable to attempt a rebound during a bearish candle. If the gold price fails to stabilize above $4410 and continues to decline, the strong support level at $4210, which is at a 180-degree angle, should be noted. This level is slightly below the Fibonacci 100% extension of the decline, which is at $4227.91. Therefore, it is expected that if the gold price drops to the $4200 level, there is a high possibility of a strong rebound. The above content is for reference only and does not constitute investment advice.
2026-03-20
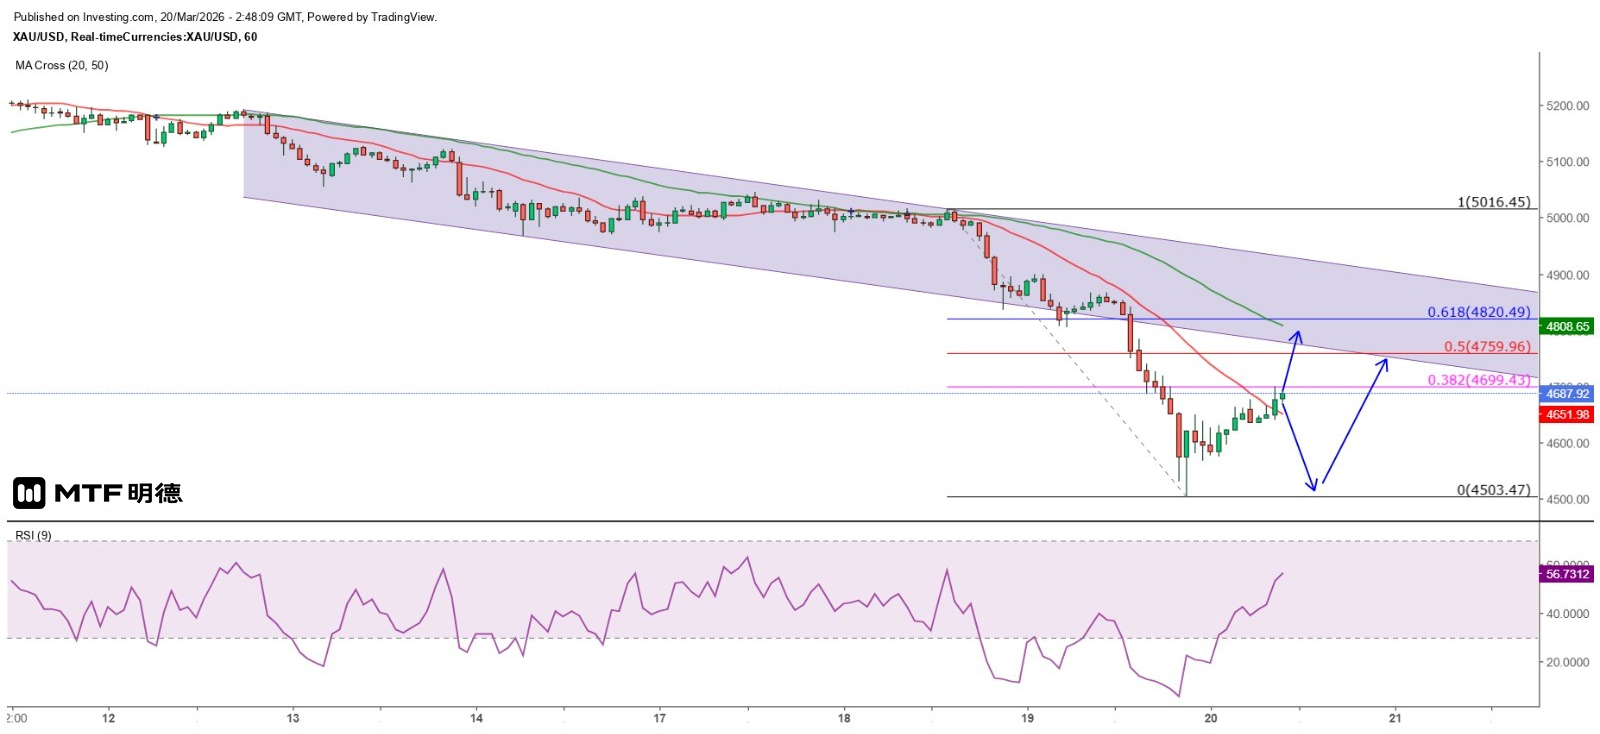
"Gold Price at $4,810 Marks First Resistance for Rebound" 20/3/2026 10:45 Finalized Yesterday, the gold price plunged sharply, with the spot gold price fluctuating by nearly 365 US dollars in a single day. It hit a low of 4,503.47 US dollars in the early trading session in New York. I believe there are two reasons for the sharp drop in the gold price. First, the Federal Reserve announced that it would maintain interest rates unchanged and did not lower the median target for the federal funds rate in the next three years. The rate for this year remains at 3.4%, and for the next two years, it remains at 3.1%, meaning that the rate will stop at 3% to 3.25%. I have pointed out that when the interest rate cut cycle ends, it is the time when the gold price rally ends. As we can see now, the interest rate cut cycle is approaching its end. I have also pointed out that this is not a zero-interest rate era. Holding cash offers a certain interest rate return, and both interest rates and gold have anti-inflation effects. Investors naturally choose cash with returns. On the other hand, Trump stated that the United States does not lack crude oil and there is no need to maintain the Strait of Hormuz shipping lane. China, Japan, South Korea and Europe are the main users of this shipping lane. Let them solve the problem themselves. Especially when the United States asked these countries to send warships to maintain the safety of the shipping lane and was refused, why should the United States still provide them with a protective umbrella? I have long said that when the US-Iran war will end depends on Trump. Once this statement was made, it was equivalent to the United States suspending further military actions against Iran. The direct reaction of the financial market was that the Middle East war eased, which was the main reason for the second wave of gold price decline. Of course, it is unknown whether he has other plans to catch Iran off guard when it relaxes its guard. Spot gold prices fell below the 50-day simple moving average (SMA) on the daily chart (currently around 4980) on Wednesday but failed to stage a strong rebound. Instead, they were further pressured by Trump's remarks and have now dropped nearly 300 dollars from the 50-day SMA, leaving considerable room for a rebound. This has attracted market players to cover their short positions. Moreover, the sharp decline yesterday pushed the 9-hour RSI to 5, indicating severe overselling and driving gold prices to gradually recover. Currently, gold prices are holding above the 20-hour SMA (currently around 4652). Gold prices are expected to rebound further within the day. As 4660 dollars is at a Gann level angle, if gold prices can hold above this level, the next significant resistance level would be at the 45-degree angle at 4810 dollars, which is very close to the 50-hour SMA (4808). Therefore, gold prices are likely to fluctuate between 4660 and 4810 dollars within the day. In a worse-case scenario, gold prices may fall again and form a double bottom on the hourly chart before rebounding. However, external risk events often occur on Saturdays or Sundays, so it is not advisable to hold positions over the weekend. The above content is for reference only and does not constitute investment advice.
2026-03-19
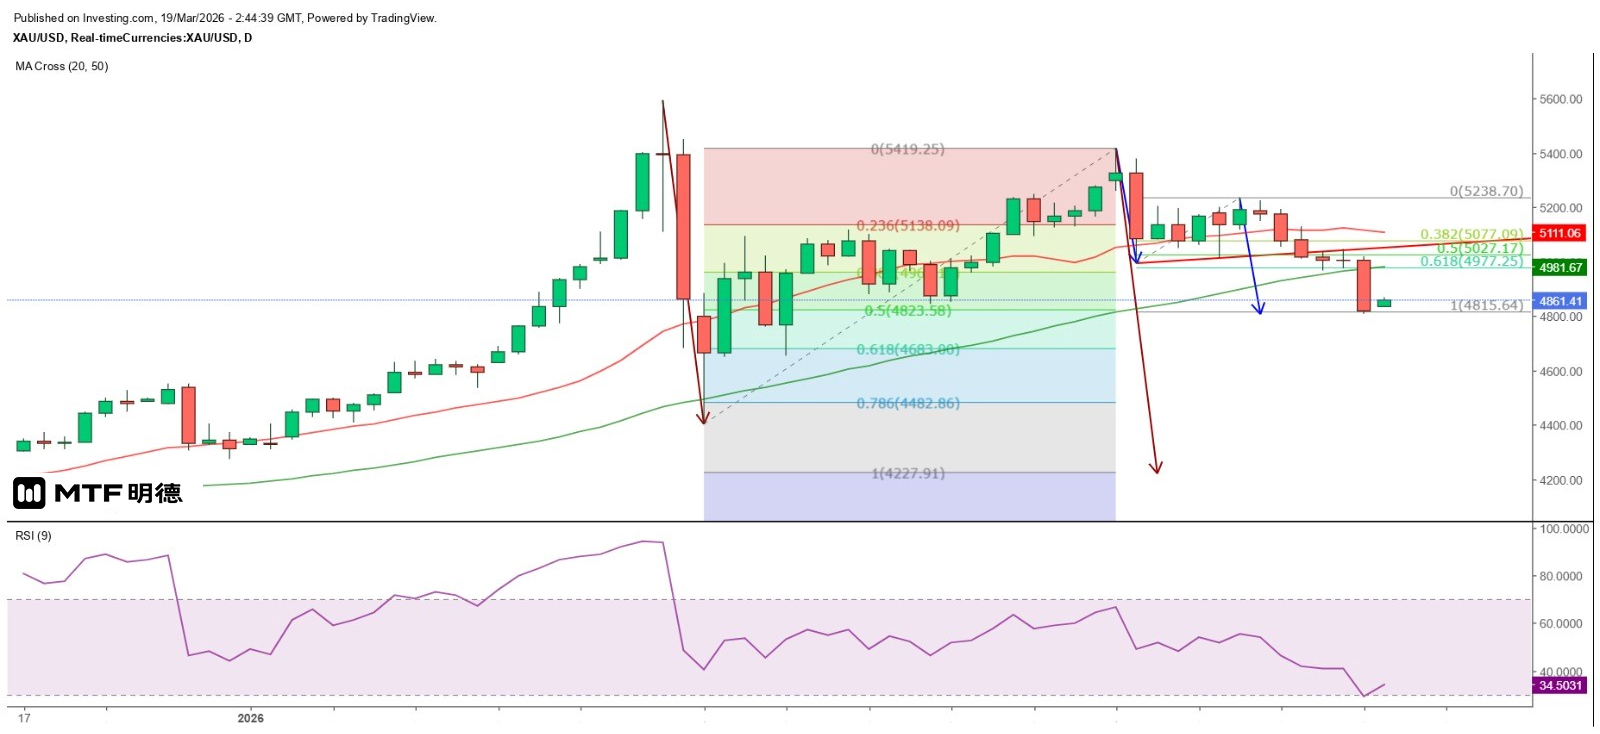
"Gold Price's 50-Day Moving Average Becomes Resistance for Bounce" 19/3/2026 10:42 Finalized Yesterday, after its interest rate meeting, the US Federal Reserve announced that it would maintain the target range for the federal funds rate at 3.5% to 3.75%, in line with expectations. The post-meeting statement indicated that the US economic activity continued to expand steadily, but job growth was low, the unemployment rate had seen minor fluctuations recently, and inflation remained somewhat high. The statement also noted that the development of the situation in the Middle East posed uncertainties for the US economy, and the authorities would pay attention to its two-way risks. In the press conference, Federal Reserve Chair Powell said that since September to December last year, the interest rate has been cut by 75 basis points in total, bringing the policy rate back to a possible neutral range. The economy as a whole has been expanding at a steady pace, with consumer spending remaining resilient and business fixed capital investment continuing to grow. According to the latest forecast, the median growth rate of real GDP this year is about 2.4%, and about 2.3% next year, slightly higher than the 2.3% and 2% predicted in December last year. The unemployment rate is expected to remain at 4.4% this year, and PCE inflation is expected to reach 2.7%, higher than the 2.4% predicted in December. Powell also pointed out that the impact of the situation in the Middle East on the US economy is uncertain. The recent rise in energy prices will push up overall inflation in the short term, but the extent and duration of the impact remain to be seen. The Federal Reserve will continue to monitor the risks to its dual mandate (employment and prices) and will decide whether to further adjust policy based on data, outlook and risk balance. In other words, the current monetary policy stance of the Federal Reserve is to consider whether to further cut interest rates or maintain them unchanged, which is what I emphasized is by no means considering raising interest rates. After hovering around the $5,000 level for several consecutive days, the spot gold price eventually broke below the 50-day SMA (currently around $4,981), hitting a low of $4,806.8 yesterday (with $4,810 located at the Gann 45-degree angle). Note that, measured by the Fibonacci extension line from the movement since March 2nd, yesterday's sharp decline fulfilled the 100% extension decline ($4,815.64). Therefore, it is expected that the gold price will launch a short-term rebound wave, but with the 50-day SMA as the resistance for the rebound, the gold price must hold above this line to have a chance to further test the high. If calculated based on the movement since January 29th, the 100% extension decline would bring the gold price down to $4,227.91. Therefore, if the gold price fails to recover the 50-day SMA in a timely manner, the possibility of testing the $4,200 level will increase. The above content is for reference only and does not constitute investment advice.


