
 en-US
en-US 

 Telegram
 WeChat

2026-01-16
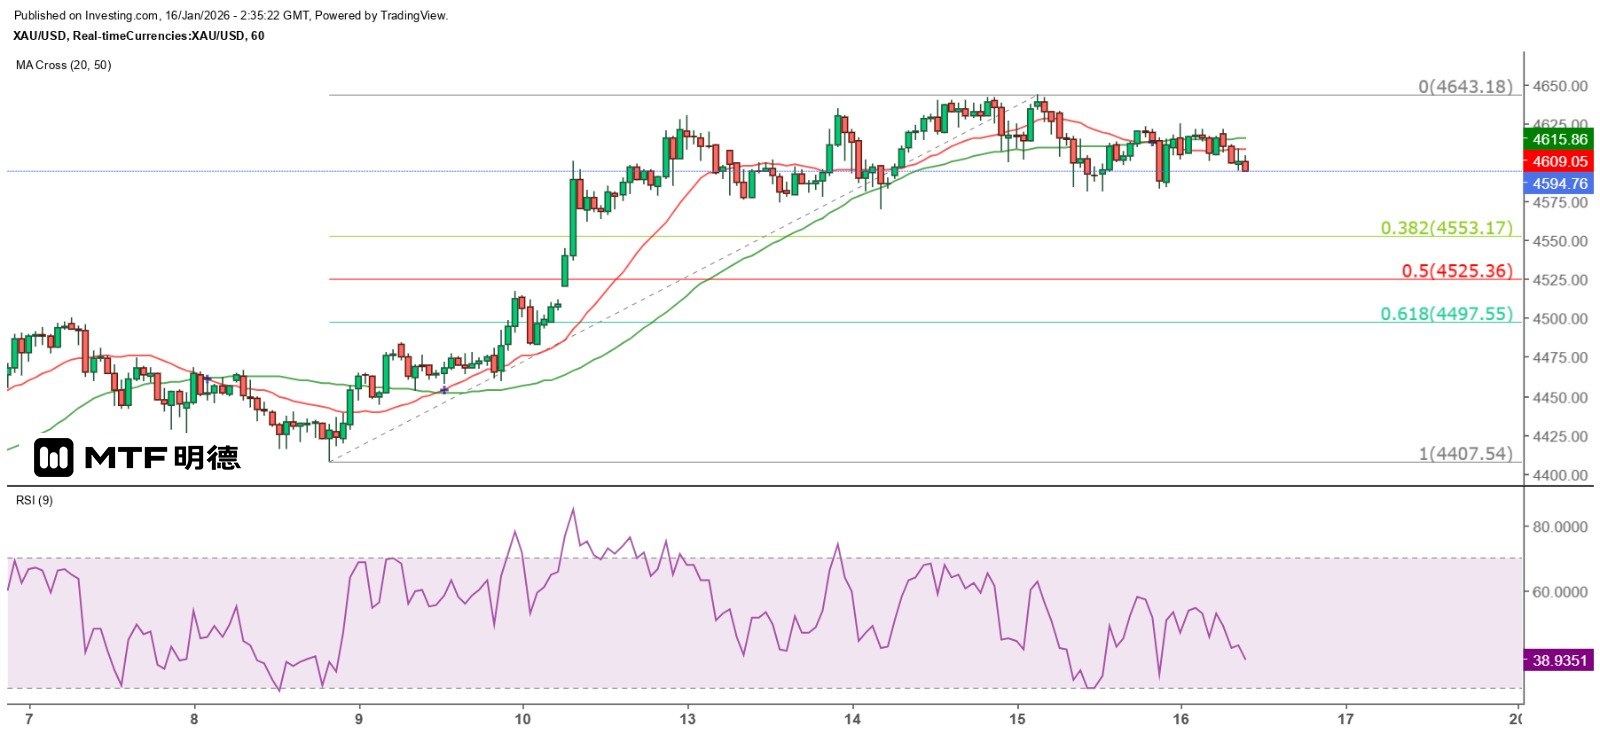
"Gold Price May Rebound at $4,510" 16/1/2026 10:34 Completed Gold prices failed to reach a new high in New York yesterday. Spot gold prices repeatedly fell below $4,600 in the early Asian session yesterday, approaching the psychological support level of $4,580. In the early New York session, it once again tested the $4,580 support level. The lowest point of the day was $4,581.2. After the London market closed, it rose as high as $4,624.64, but then dropped sharply. This morning, the performance in the Asian market was weak. After reaching a high of $4,621.09, it continued to decline. From this, it can be judged that $4,600 is no longer a strong support. From the hourly chart, the spot gold price has been consolidating in a sideways pattern at a high level, and is likely to gradually transform into a round top pattern, indicating that the gold price is preparing to enter a correction phase. Within the day, it is expected to break through $4,580 and test $4,560, or even $4,510, before a rebound is possible. Silver prices plunged after hitting a record high of $93.7 in the early Asian session yesterday. They dropped as low as $86.29 before rebounding continuously. In the late New York session, they rose as high as $93.04 but then fell again. Technically, a double top formation emerged, with $86.29 serving as the neckline support. If this level is breached, the measured decline target for silver prices would be $78.88. Investors should note that from the monthly chart, the 9RSI of gold and silver prices are currently at 96.8 and 96.4 respectively, which is the most overbought period in history. Even if it does not lead to a long-term decline, occasional major correction waves could reach several hundred dollars. I believe that the significant rise in silver prices is mainly due to the fact that silver has lagged far behind gold in the past few years, while gold has continued to strengthen. Some market analysts attribute this to the process of de-dollarization, but I think the most important factor is that major economies are expected to enter another interest rate cut cycle in 2024, leading to an abundance of market funds. Most of these funds flow into the stock market, and the profits generated from rising stock prices are equivalent to a substantial increase in the money supply. Some of this money then shifts to other financial markets. Under the pretext of unstable geopolitical situations and de-dollarization, precious metals naturally become the target of capital inflows. I believe that in the second half of this year, the monetary policy stance of the Federal Reserve after the change of leadership and the interest rate trends it promotes will have a significant impact on the prices of gold and silver. The above content is for reference only and does not constitute investment advice.
2026-01-15
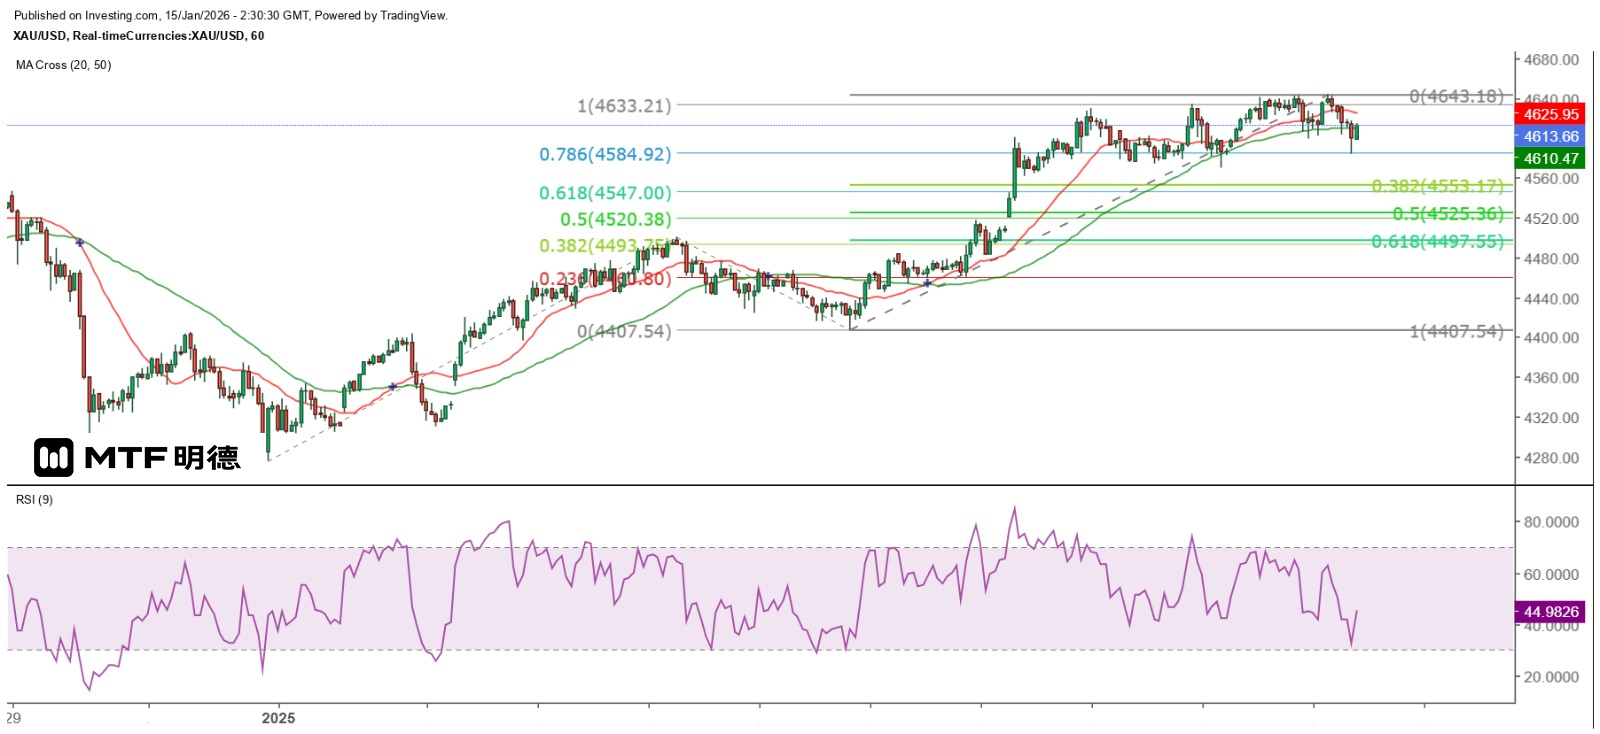
"Gold Price Short-Term Adjustment Likely Unfinished" 15/1/2026 10:28 Finalized Yesterday, the gold price exhibited extraordinary volatility. As seen from the 5-minute chart, after the European market opened, the spot gold price was below $4,640, fluctuating rapidly within about $15 to $20. It then plunged sharply at the beginning of the New York trading session, briefly touching below $4,600 before rebounding to around $4,626 and falling again. It hit a low of around $4,601 and then staged a double bottom rebound. At the end of the New York trading session, it slightly broke through and reached a new historical high of $4,643.18. However, it closed with a shooting star pattern. Although it rebounded again later, it lost momentum after rising to $4,641.6 and began a deeper correction wave, confirming that the Gann level angle at $4,660 indeed poses a significant resistance. This morning, the spot gold price bottomed out at $4,584 and gradually rebounded. However, the 5-minute chart still shows a pattern of each wave being lower than the previous one. The first resistance level is approximately $4,618.5. From the hourly chart, the spot gold price has temporarily returned above the 50SMA at $4,610.4. Currently, the trading range can be divided into four parts. As of now, the gold price is expected to fluctuate between the 20SMA ($4,625.8) and the 50SMA on the hourly chart. If it breaks through and holds above the 50SMA, it may return to the higher trading range, that is, between the 50SMA and $4,660. Conversely, if it falls below the 50SMA, the gold price will continue to search for a bottom, and the possibility of testing $4,560 will increase. $4,500 is the ultimate pullback target. However, from the daily chart, gold closed with a bullish candle yesterday and reached a record high close, indicating that the gold price is still in an uptrend. A close below $4,585 would be the first bearish signal. However, it should be noted that the daily chart of the gold price has shown a divergence with the 9RSI. Once the bullish-bearish candlestick pattern confirms a bearish trend, investors should not ignore it. Additionally, using the Fibonacci extension to measure the movement since December 31, the gold price has slightly broken through the 100% extension level of $4,633.21. The subsequent sharp decline indicates that this level has significant resistance. Assuming that the gold price will not reach a new high, the ultimate adjustment targets for the next few trading days are $4,525 and $4,500. The above content is for reference only and does not constitute investment advice.
2026-01-14
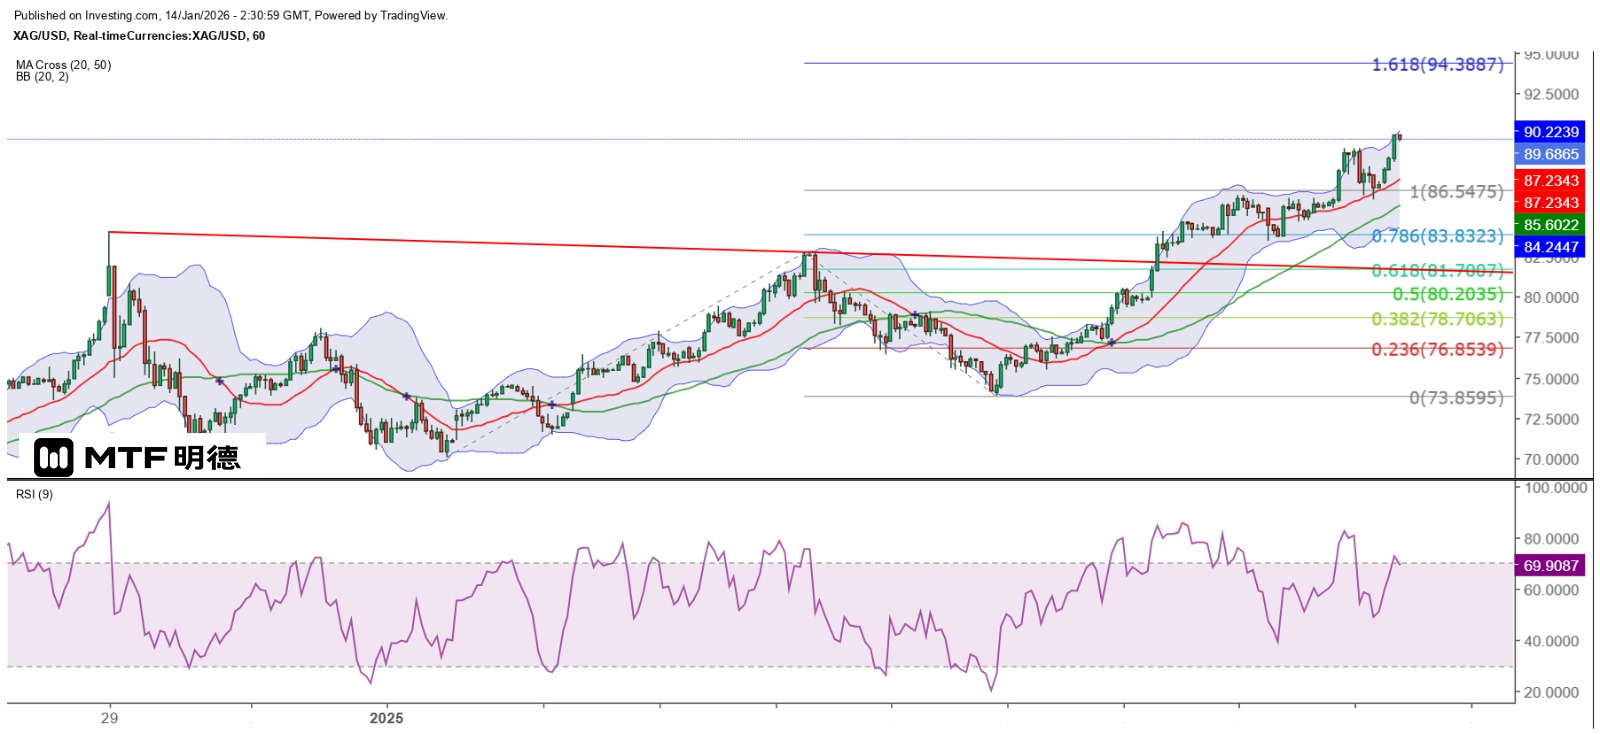
Gold and Silver Break Records Again, Expected to Rise with Volatility 14/1/2026 10:29 Completed Gold and silver prices have remained strong, both breaking through their previous highs and invalidating my prediction yesterday that they had peaked. This morning in the Asian market, silver reached a high of $89.96. Gold also hit a high of $4,634.29 in the early part of the New York market yesterday, setting a new all-time high. However, it gradually declined and closed at a low of $4,569.77. This morning, it has rebounded and reached a high of $4,620.73. I believe that the geopolitical situation is the main reason for the new highs of gold and silver and their maintenance in a high range of fluctuations. However, its impact can be extremely short-lived. Subsequently, the market can continue to push up the gold price based on the further decline of the US interest rate. On the other hand, CME will also continue to increase the margin of gold and silver to curb speculative activities. Therefore, the overall trend of gold and silver is expected to be a repeated and fluctuating upward movement. From the hourly chart, gold prices have shown a sideways movement at a high level. The expected range of fluctuation is between 4,560 and 4,660 US dollars. Assuming that the gold price has held steady at 4,600 US dollars, it is likely to fluctuate within the range of 4,600 to 4,660 US dollars. However, 4,633.21 US dollars still poses resistance. Only by breaking through and holding steady above this level can there be a chance to challenge 4,660 US dollars. Otherwise, the gold price may fluctuate around 4,610 US dollars within a range of 50 US dollars, that is, within the aforementioned larger range. Silver at $89 is likely to find support. As for the silver price, $89 is expected to be a strong support level for the day. However, the current hourly chart trend shows a slight divergence with the 9RSI, and it is close to the top of the Bollinger Band. The price may gradually test the lower level during the day. But if it only falls gradually with small candle bodies, it may develop into an ascending flag pattern, increasing the possibility of breaking the previous high. Therefore, the 50SMA on the 5-minute chart (currently around $89.19) should be the first important support level. If it is broken, then see if $89 can hold. Finally, the 20SMA on the hourly chart (currently around $87.24) should be the ultimate profit target. The above content is for reference only and does not constitute investment advice.
2026-01-13
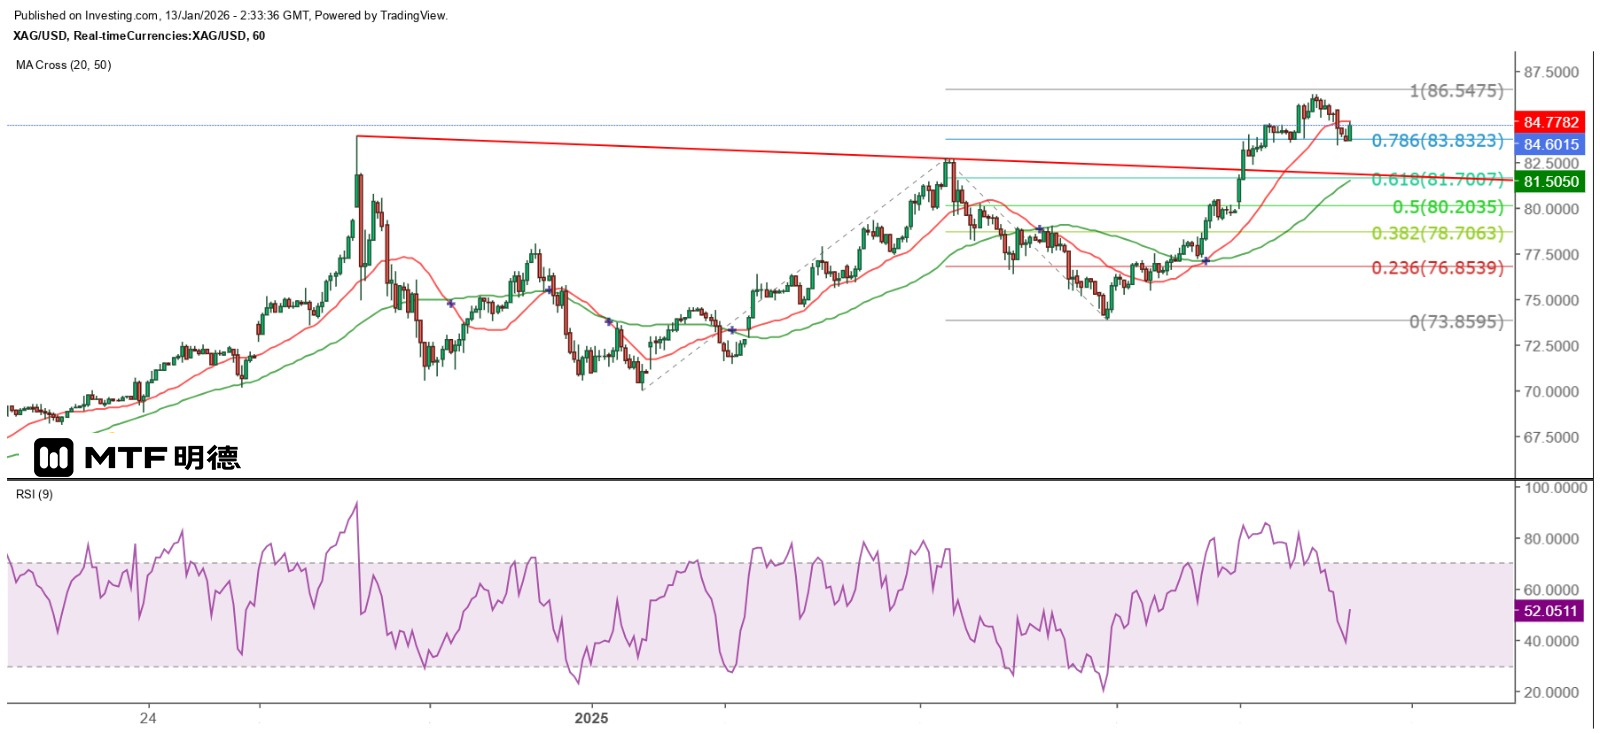
"Short-term rally in gold and silver expected to end" 13/1/2026 10:32 Completed Yesterday, both gold and silver prices soared. The spot gold price reached a high of $4,630.09 in London after the market closed, while the silver price hit a high of $86.24, both setting new historical records. However, they both dropped sharply afterwards. Today, in the early Asian market, they fell to $4,575.57 and $83.43 respectively. The sharp rise and subsequent fall of gold and silver prices are believed to be directly influenced by the CME's increase in margin requirements for both. The initial margin for the March silver futures contract was raised by $3,000 to $25,000, while the initial margin for gold futures contracts was increased to $22,000 and $24,200 from $2,000 and $2,200 at the end of last month. The aim is to reduce speculative activities in gold and silver to lower their volatility. From the hourly chart, using the Fibonacci extension lines to measure the movement since December 31st, if the spot gold price reaches the 100% extension level, it will be at $4,633.21, which is very close to yesterday's high of $4,630.09. It is also only about $27 away from the strong resistance level of $4,660 on the Gann Square. It is estimated that the short-term upward trend of the gold price has come to an end, and the previous peak of the upward trend before this, that is, $4,500.5, will become the retracement target and a strong support level. It is expected that after the gold price stabilizes at this level, it will launch a new round of offensive. As for the silver price, from the hourly chart, due to its high volatility, even if the Fibonacci extension line is used to measure, the time starts from January 4th. If it reaches the 100% extension level, the silver price could be around $86.55, which is very close to yesterday's high of $86.24. Therefore, it is also regarded as the completion of the upward trend. The retracement target for the future is $82.75. Besides technical factors, whether the US will send troops to Iran will affect the price trend of gold and silver. However, I believe that even if they rise, it will be short-lived, or they may even fall sharply in response. This is because the US military action against Iran will not be a protracted war! The above content is for reference only and does not constitute investment advice.
2026-01-12
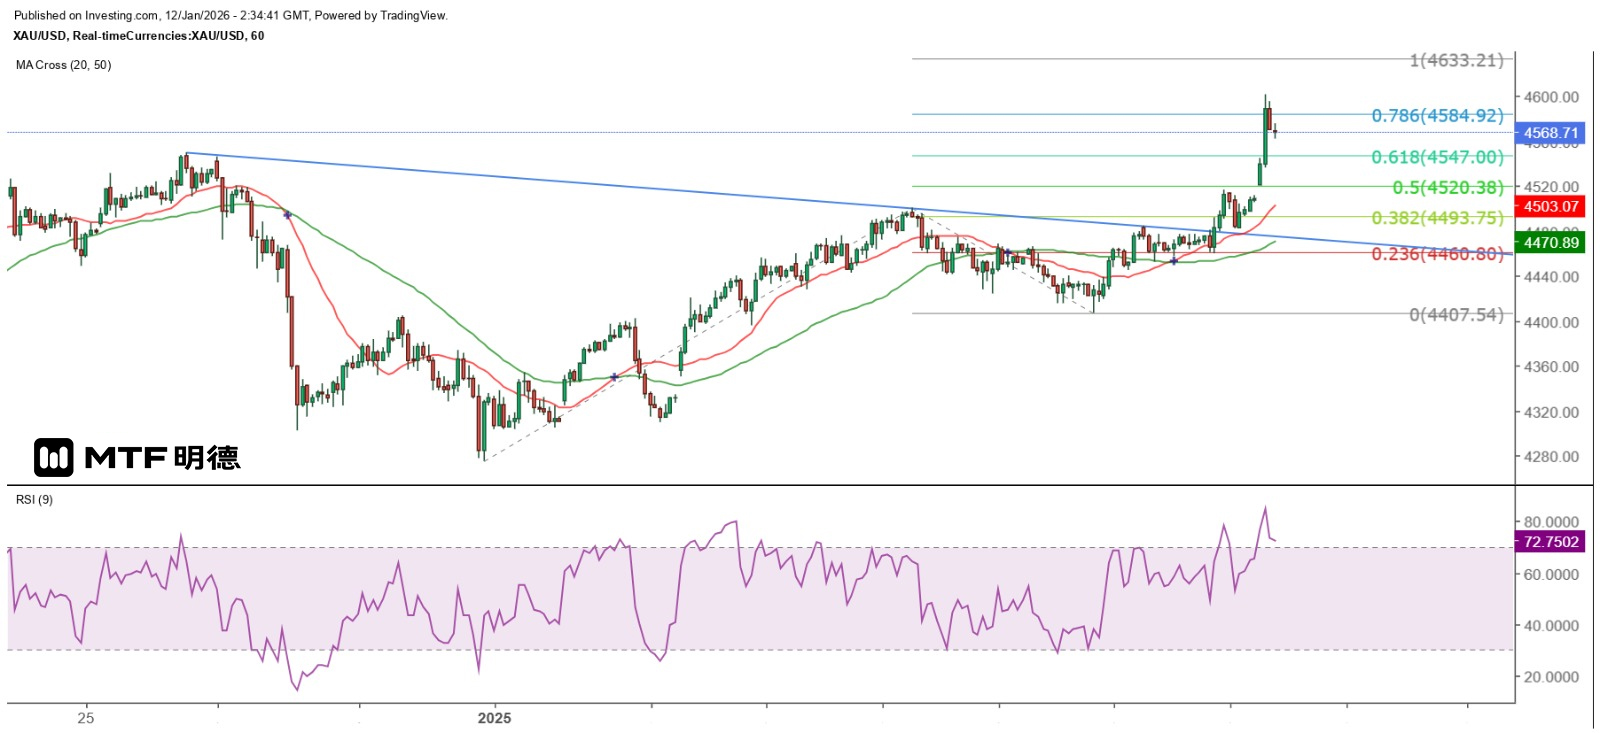
"Gold Price at $4,500 Becomes Short-Term Strong Support" 12/1/2026 10:33 Finalized Last Friday, gold prices broke through the $4,500 mark with the help of the poor December non-farm payroll data, reaching a high of $4,517. Although it retreated in the New York midday session, it rebounded after hitting a low of $4,482 and closed at $4,510.45, which was a secondary resistance at the 315-degree angle of Gann's theory. It was uncertain whether it would break down or up. However, this morning, gold prices opened higher in the Asian session with a gap and continued to climb, reaching a high of $4,601.17. Subsequently, a head and shoulders pattern emerged on the 5-minute chart, and it gradually declined. Gold prices suddenly soared, believed to be due to the US Department of Justice sending a grand jury subpoena to the Federal Reserve Board last Friday, threatening to file criminal charges against Fed Chair Powell's testimony before the Senate Banking Committee last June, which partly involved the Fed's multi-year renovation plan for its office building. As such, the sharp rise in gold prices this morning lacks a more lasting support. According to CME FedWatch, the interest rate futures market expects the Fed to keep interest rates unchanged at all monetary policy meetings before June this year, and to cut rates by 25 basis points at the June meeting, right after Powell's term ends. Moreover, whether Powell will be convicted will go through a lengthy judicial process, which inevitably leads people to view this event from a conspiracy theory perspective, with Trump attempting to divert public attention. Despite gold and silver prices hitting new record highs, the rationale supporting further gains in gold prices is extremely fragile. Technically speaking, gold prices found support at $4,561.92 this morning, and $4,560 is one of the Gann angles, indicating that gold prices are likely to fluctuate between this level and $4,610 within the day. The stronger resistance level is at $4,660 on the horizontal line. In contrast, $4,550 and $4,500 have become short-term strong support levels. Unless the above-mentioned events become clear and are in Powell's favor, there is currently no reason to expect gold prices to fall below $4,500. Gold prices are likely to fluctuate between $4,560 and $4,610 within the day, with a broader range of movement between $4,500 and $4,660. The above content is for reference only and does not constitute investment advice.
2026-01-09
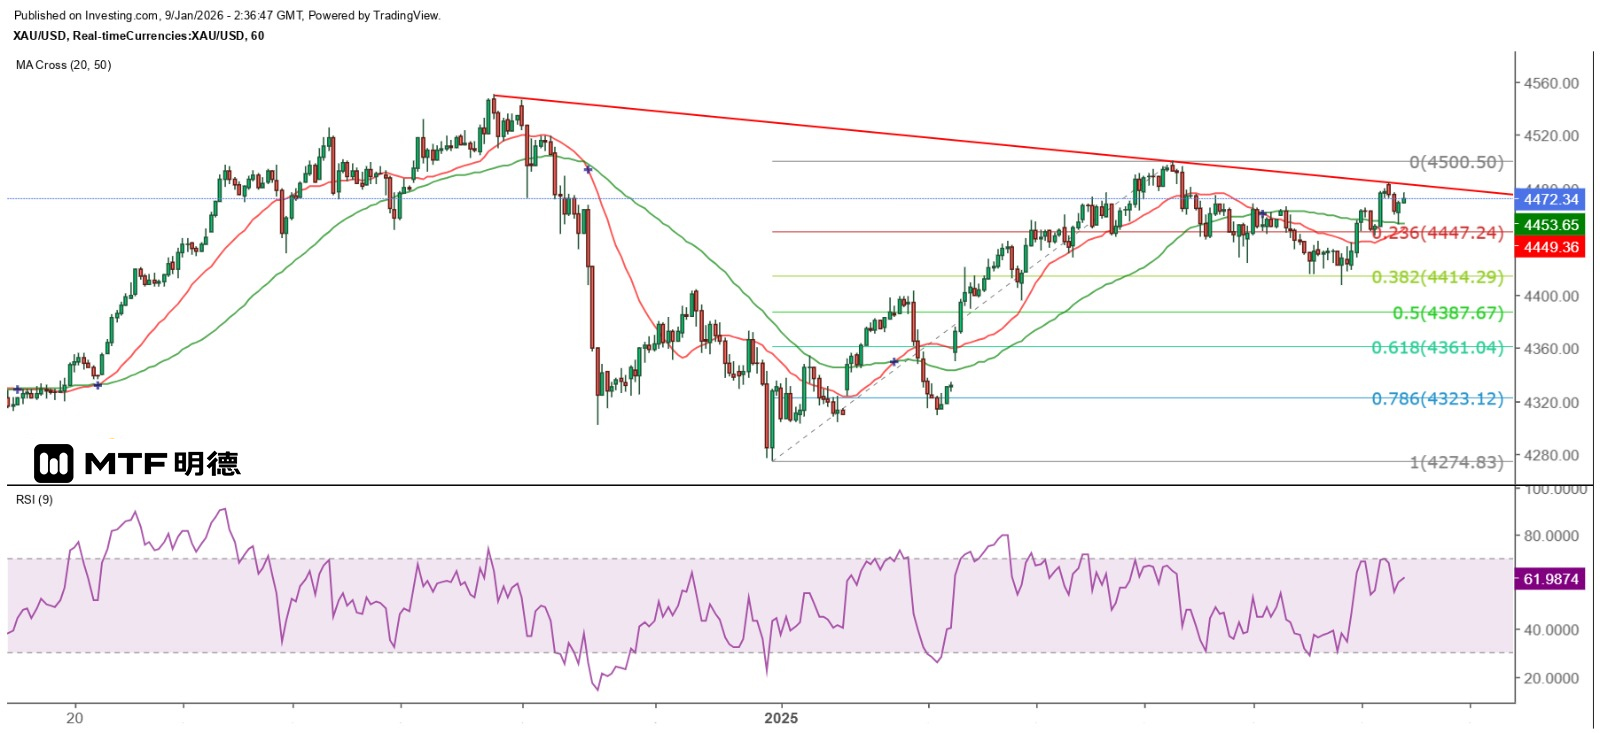
Gold prices are expected to fluctuate below $4,500. 9/1/2026 10:35 Finalized Yesterday, gold prices continued to be under pressure before the opening of the New York market. After reaching a high of $4,466.43 in the early Asian session, they fell repeatedly and hit a low of $4,407.54 before the opening of the New York market, then gradually rebounded. The trend was basically in line with expectations of fluctuating between $4,410 and $4,460. In the New York market, gold prices fluctuated upward, approaching $4,480 before being blocked and falling back. It is believed that this is related to Trump's remarks. The US military captured Venezuelan President Maduro last week and brought him to the US court for trial. Although it did not trigger obvious risk-aversion actions in the market, he later warned Colombian President Petro (Gustavo Petro) to "be careful", leading people to speculate that he is the next target to be captured. However, the main reason for the rise in gold prices is believed to be his hint that the US wants to "own" the entire Greenland. Currently, the United States already has a military base in Greenland - the Thule Air Base (Pituffik Space Base). However, Trump stated that the area is filled with Russian and Chinese ships, and from a national security perspective, the United States needs Greenland. On the other hand, Greenland is rich in rare earth minerals, which are crucial for the production of smartphones, electric vehicles, and military equipment. In response to Trump, Greenland's Prime Minister Jens-Frederik Nielsen said that the idea of the United States controlling Greenland is a fantasy, but they are willing to engage in dialogue and discussion through legitimate channels and in accordance with international law. In fact, the current situation is somewhat similar to the circumstances before the outbreak of the Russia-Ukraine war. Russia believes that the continuous expansion of NATO poses a threat to its security. The United States could also use this as an excuse to occupy Greenland by force, and Greenland might even allow the United States to increase its military presence on the island. In short, I think it would be easy for the United States to take over Greenland, but it would surely face international condemnation. But what can be done? Only those with ulterior motives might take the opportunity to manipulate financial asset prices under the pretext of avoiding risks and make a profit. The U.S. Department of Labor will release the December non-farm payroll report tonight. If the change in non-farm employment is in line with expectations or slightly better, what reason could there be for gold to rally? This morning, spot gold reached a high of $4,484.46 before slightly pulling back. From the hourly chart, although the trend is still upward, it clearly encounters resistance near the previous high of $4,500.50. If it can rise above $4,500 and hold that level, the possibility of challenging $4,550 increases, but the chance of setting a new high is not high. Of course, another consideration is that the geopolitical risks triggered by the U.S. have risen recently, but gold has remained calm. Is it waiting for the non-farm payroll report as the last straw to launch a full-scale attack? However, regardless, prices reflect everything. There's no need to guess. I estimate that before the release of the non-farm payroll report, gold is likely to fluctuate below $4,500, and $4,410 remains a strong support level. The above content is for reference only and does not constitute investment advice.
2026-01-08
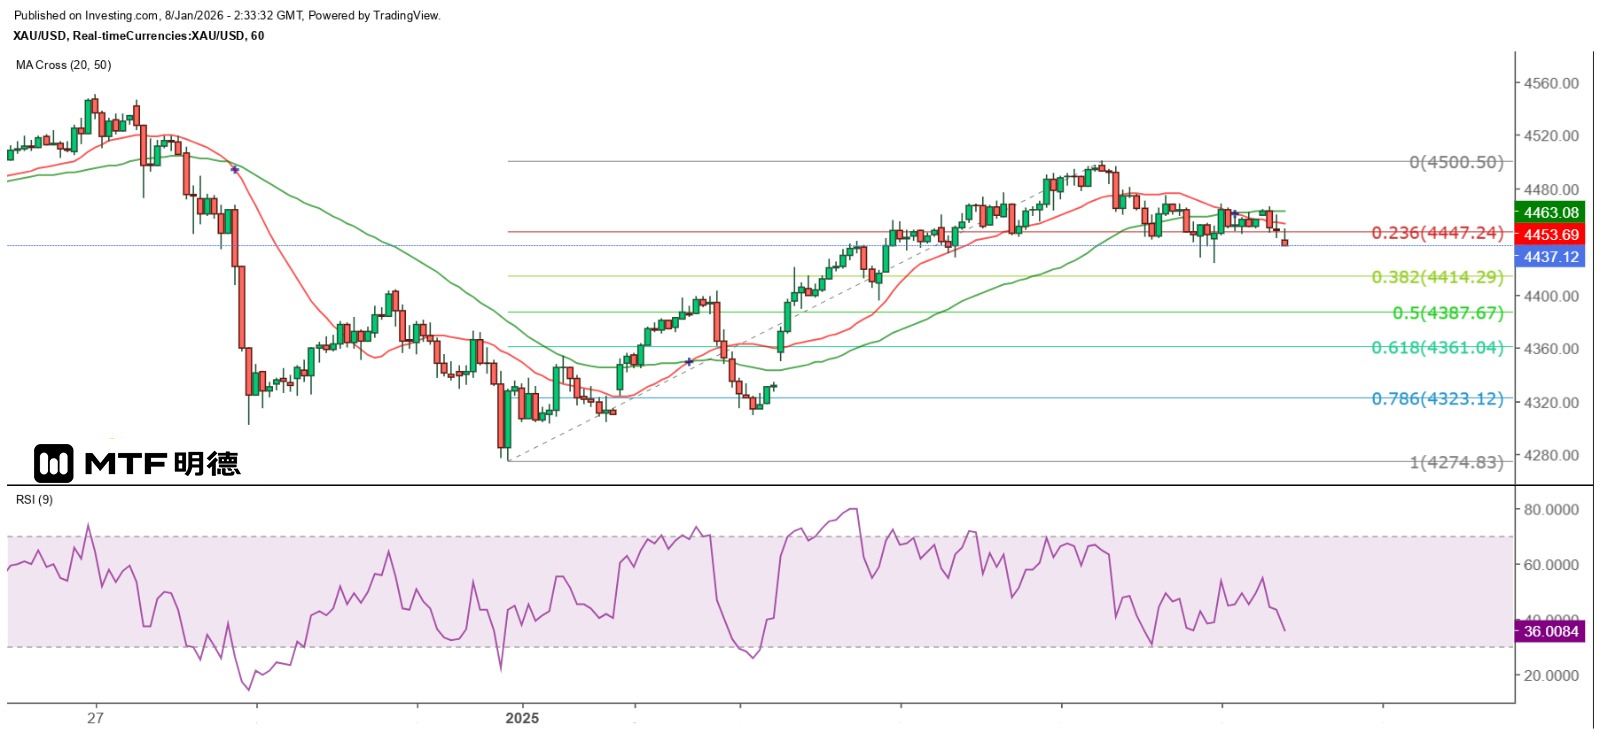
"High Probability of Gold Price Breaking Downward" 8/1/2026 10:31 Completed Yesterday, the ADP in the US announced that the number of jobs in private institutions increased by 41,000 in December, which was less than the expected 49,000. The change in employment positions in November was revised upward from a decrease of 32,000 to a decrease of 32,000. After the release of the data, the gold price dropped sharply. The spot gold price fell from $4,445.66 to $4,427.95 and then rebounded, but was blocked at the $4,454 level. It then dropped again, hitting a low of $4,423.81 before a stronger rebound occurred. After the London market closed, it rose to $4,468.54 and then dropped again. This morning, it rose to $4,466.84 and then fell back, but found support at the $4,440 level. Judging from the reaction of gold prices to the ADP employment data, the market is not overly pessimistic about the performance of the US job market. Unless the non-farm payroll figures for December, which will be released this Friday, are extremely poor, the retail sales performance should be relatively better in December due to the Christmas and New Year effects, and the demand for labor in the service industry is greater. Therefore, the non-farm payroll data should not deviate significantly from expectations. It is expected to hold steady at around $4,400 within the day. From the hourly chart, gold prices have successively broken through the 20SMA (4454.14) and 50SMA (4463.26). After reaching a high of $4,500.5 on Wednesday, they have been on a downward trend. The subsequent movement has gradually taken on a sideways pattern, with the highest hourly closing price also gradually declining. The sideways consolidation at the high end indicates that a breakthrough movement in gold prices is imminent. The current trend clearly leans towards a decline. The expectation of a short-term peak yesterday has been fulfilled. $4,410 is believed to be the first target for a test within the day, and it is still expected that gold prices will tend to fall to $4,387.67 (the 50% retracement level since December 31) before stabilizing. On the other hand, gold prices formed a double top at $4,404 on December 30 and January 2. It is expected that there will be a struggle for gold prices to fall below $4,400 within the day, but $4,460 is likely to be the resistance for the intraday rebound. Gold prices are expected to be trapped in a range of $4,460 to $4,410, but the overall trend remains weak. The above content is for reference only and does not constitute investment advice.
2026-01-07
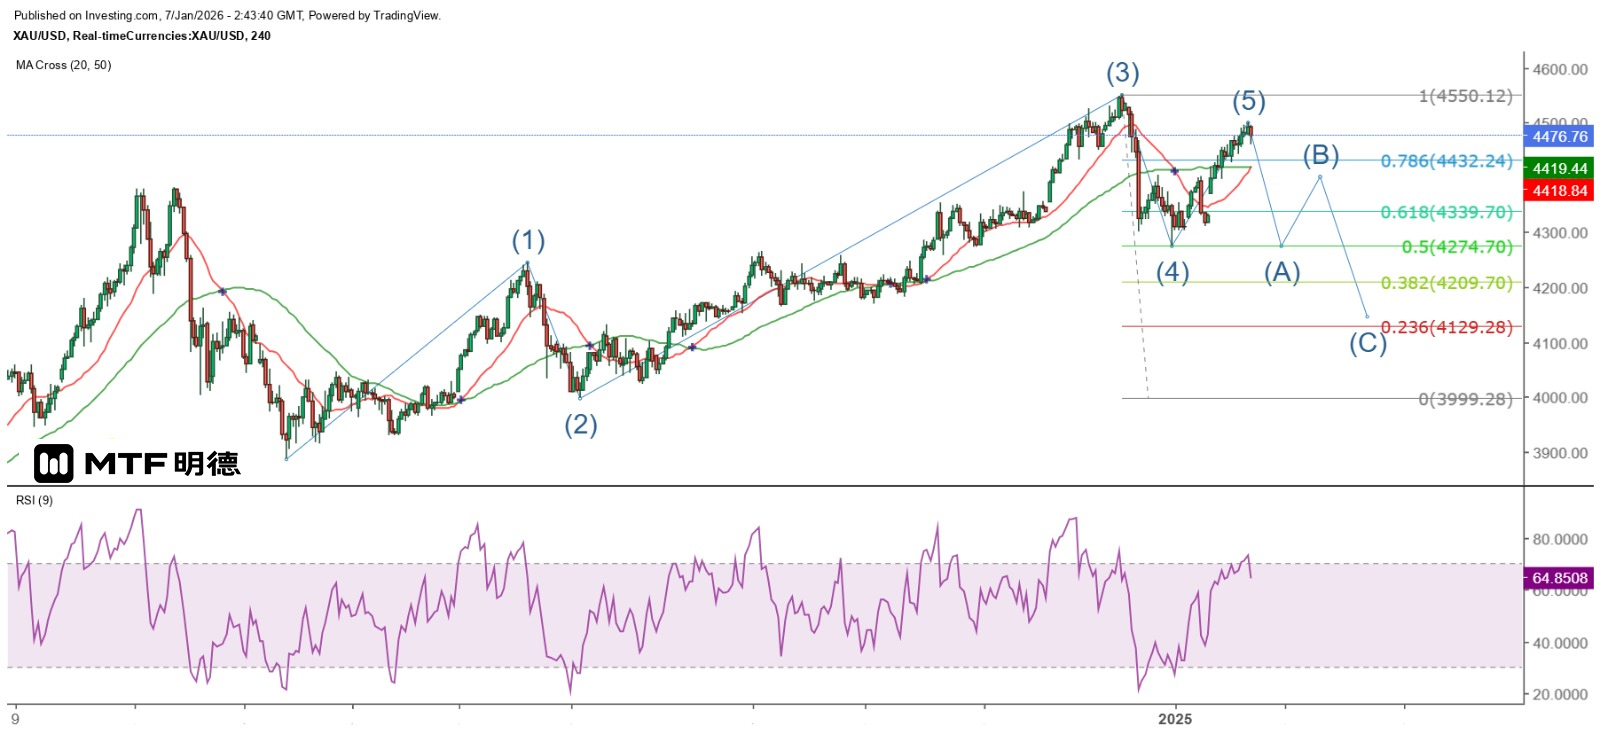
"High Probability of Gold Price Peaking in the Short Term" 7/1/2026 10:41 Completed Spot gold prices reached a high of $4,500.5 in the early Asian session today and have continued to decline. From the hourly chart, it can be seen that the gold price has broken through the 20SMA ($4,475.6). Does this indicate the end of the upward trend that began after the gap-up on Monday this week? Yesterday, it was pointed out that the short-term cycle top of the gold price would appear today. Currently, a downward signal has emerged on the hourly chart. Secondly, from the perspective of wave theory, the starting point of wave 1 was formed at the low of $3,886.66 on October 28 last year. Wave 2 adjustment began at $4,245.15 on November 13, and then entered wave 3 at $3,998.13 on the 18th, ending at the historical high of $4,550.12. The low of wave 4 was on December 13 at $4,274.83 (close to the top of wave 1 at $4,245.15), and then came wave 5, which ended at $4,500.5. The wave theory is closely related to technical patterns. The relationship between the aforementioned 3-wave and 5-wave can also be described as a double top (referred to as a failed 5-wave in wave theory). Otherwise, the 3-wave might actually be a 5-wave. In that case, the recent rebound would be wave a, and the subsequent waves b and c could form a triangle or a pattern where each wave is lower than the previous one. If so, the rebound since the beginning of this year would be an escape opportunity, as wave c would fall below the bottom of wave 4. If measured simply by the double top, the target for the decline would be $3,999.54. Even if the gold price hits a new intraday high today, the probability of it falling back in a double top formation remains very high regardless of whether it can break through the top of the previous 3rd wave and set a new all-time high. The only thing I need to consider is that the normal 5th wave of the gold price (or other financial asset prices) is higher than the top of the 3rd wave, so it cannot be ruled out that the gold price will rise again. This morning's adjustment may be due to investors closing their positions in advance before the release of two important employment data in the US. However, it can also be inferred that the gold price will be weak before the release of the US ADP's December employment data tonight. The strong resistance will be at $4,500 to $4,510, the first support will be at $4,460, and the strong support will be at $4,410. The above content is for reference only and does not constitute investment advice.
2026-01-06
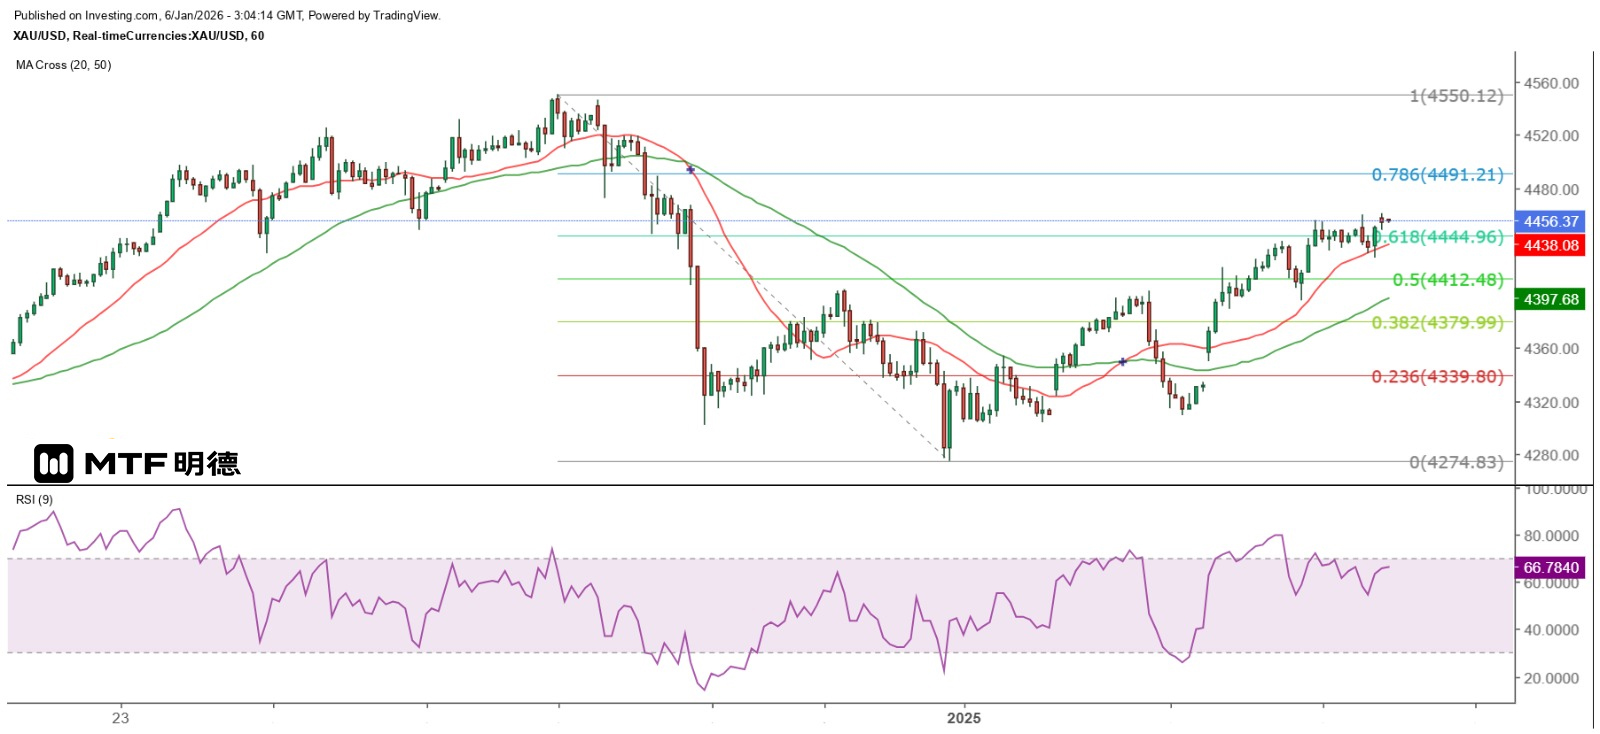
"Gold Prices Expected to Be Pressured by ADP Data" 6/1/2026 11:01 Finalized The gold price trend yesterday was generally characterized by a fluctuating upward pattern. A significant adjustment occurred during the European midday session to the early New York session. The spot gold price reached a high of $4,440 before dropping significantly, but it rebounded after hitting a low of $4,395.8 and climbed to a new intraday high of $4,455.82. This was coinciding with the release of the latest US ISM manufacturing PMI, which dropped from 48.2 in November to 47.9 in December, indicating that the US manufacturing sector has been contracting for the tenth consecutive month. The rise in gold prices is believed to be driven by the decline in interest rates rather than any connection with Venezuela. ADP will release the December private sector employment change in jobs tomorrow. The market expects an increase of 67,000 jobs. The US Department of Labor will release the December non-farm payroll report this Friday. The market expects an increase of 57,000 jobs and the unemployment rate to drop by 0.1 percentage point to 4.5%. Assuming that the number of jobs in the US is still increasing, but the monthly growth rate is clearly less than 100,000, fortunately, there has been no consecutive two-month decline yet. However, if it happens, it will surely intensify investors' concerns about the US economic outlook, and the gold price may rise sharply again as a result. It is not advisable to place heavy bets on a rebound trend. This morning, the spot gold price rose to a high of $4,461.25 before falling sharply. After breaking through $4,449, it rebounded and has stabilized above $4,450 for the time being. The lowest point in the early Asian session was $4,428.25, indicating that the gold price is currently fluctuating within the range of $4,410 to $4,460 on the Gann Square. From the hourly chart, the current gold price has rebounded by more than 61.8% from the largest decline since December 27th. However, the large bearish candle on December 29th still makes me not too optimistic about the future of the gold price. The gold price must break through and hold above $4,550 to have the potential to reach new highs. Otherwise, any rebound at present, even approaching $4,550, should not be bet heavily on by bulls. In addition, it is expected that the short-term top of the gold price will occur tomorrow. The low point yesterday was $4,395.8, indicating that the gold price has not yet confirmed that it has held the important support level of $4,410. Therefore, it is necessary to be cautious that the gold price may test this level again after consolidating at a high level within the day. $4,460 is not an important resistance level, while $4,510 is a secondary resistance (or support). Pay attention to whether the gold price will first challenge $4,510 and then make a deeper adjustment. If the short-term top of the gold price occurs tomorrow, the ADP's December employment data is likely to be the main reason for the gold price to fall. The above content is for reference only and does not constitute investment advice.
2026-01-05
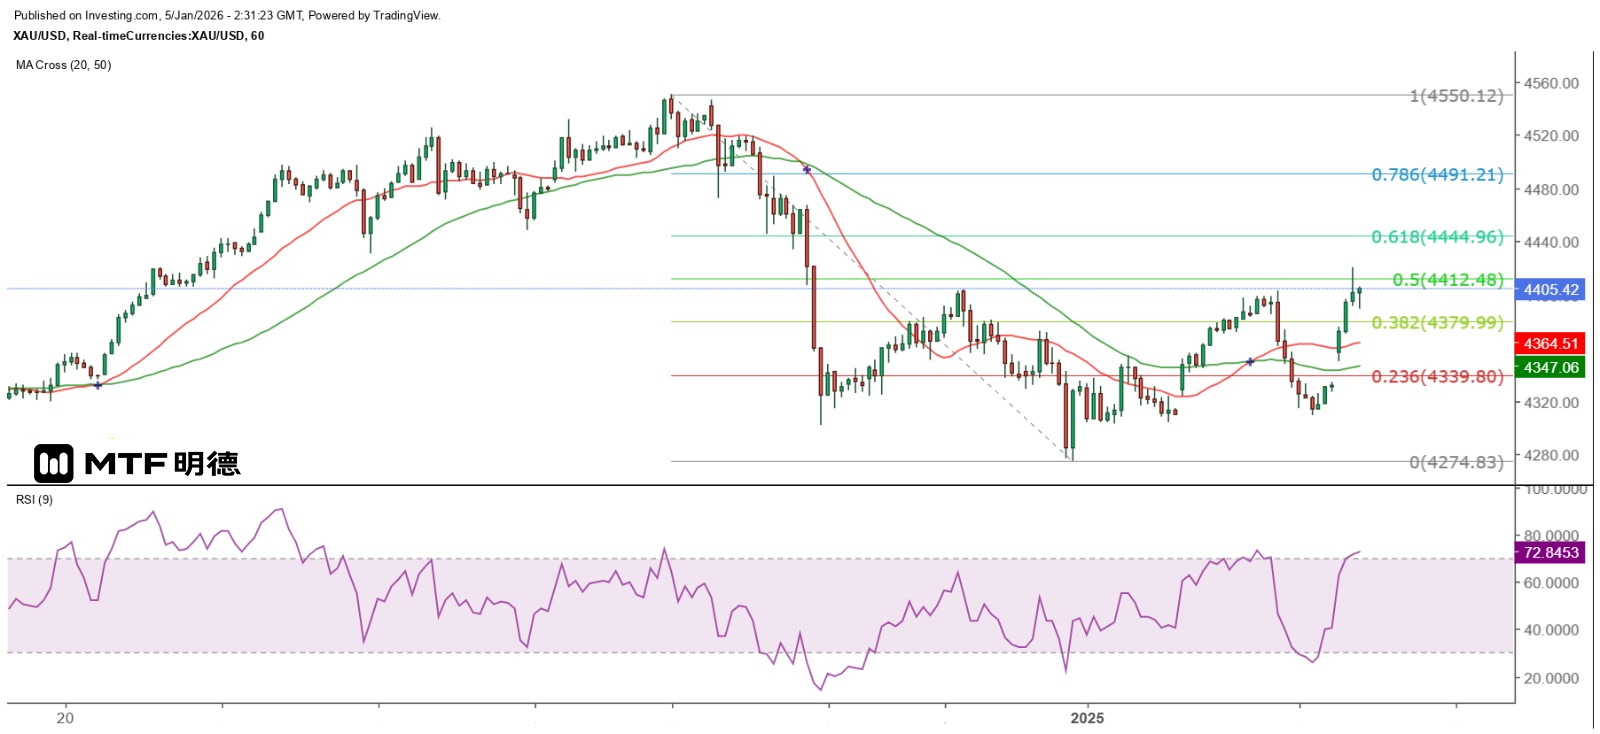
"Gold Price Sideways Below 4410 in the Short Term" 5/1/2026 10:29 Completed Entering the new year, the gold price rose above $4,400 at one point on the first trading day, but eventually dropped sharply to close at $4,330.5. This morning, the gold price rose above the $4,400 level again in the early Asian session, reaching a high of $4,420.2, but it has not been able to hold that position so far. The claim that Venezuelan President Maduro was captured by the US military and will appear in court at 12:00 Eastern Time today was just an excuse for the gold price to rise. There is no element of risk aversion involved. This is evident from the fact that the New York crude oil futures price dropped to $56.56 at one point this morning in the Asian session. The decline in inflation is not favorable for gold prices. The events in Venezuela have also led me to have a new perspective on the gold price, that is, I have doubts about whether it can reach a new high this year. This is because I expect the oil price to fall and it will be difficult to rise above 60 dollars for a long time. I even think that the New York futures oil price will drop to the 30-dollar level, and this is likely to happen within this year. Low oil prices help to lower inflation, which is not good for the gold price. Of course, you may think that the Fed's tendency to further cut interest rates is good for the gold price. But this so-called "benefit" refers to the reduction in the cost of holding gold, not zero cost. However, a low-interest-rate environment is more beneficial to the stock market and the overall economic performance. Do you think large funds or investors will increase their holdings of stocks or buy unproductive gold at high prices? In the short term, the gold price will be constrained by the 4410-dollar resistance level of the Gann Square's 270-degree vertical angle next year. From the hourly chart, it can be seen that the spot gold price has been in a sideways pattern since it fell below 4400 dollars on December 29th. Although the high of 4220.2 dollars this morning slightly broke through the 50% retracement level of the biggest decline since last week at 4412.48 dollars, it failed to hold above that level. Therefore, 4410 and 4412.48 dollars are still regarded as important short-term resistance levels for now. The gold price hit a low of 4309.87 dollars last Friday, slightly below the 225-degree angle at 4310 dollars. Therefore, it is expected that the gold price will fluctuate between 4310 and 4410 dollars in the short term at most. However, the gold price closed almost with a bearish engulfing candle on December 29th, indicating that it has peaked at 4550 dollars. In the future, it is likely to test the 50-day moving average (4201) on the daily chart before a strong rebound is expected. The above content is for reference only and does not constitute investment advice.

2026-01-02
《金價料下試4210後強力反彈》2/1/2026 10:36 完稿 2025年結束,金價一如我預期在去年底前再創歷史新高。以CME最活躍期貨月份計,2026年2月期金在2025年全年累升55.53%,3月期銀更大升128.01%,白銀位居主要交易商品升幅榜首,黃金僅在第五位,第二及第三位的是2026年4月鉑金及3月鈀金,去年兩者分別升值116.2%及75.36%,然而,兩者同在12月29日出現穿頭破腳大陰燭形態,今年能否破頂成一大問號。 金銀價格今年能否再創新高,還看美國經濟狀況及美元匯價走勢,而美國經濟表現影響利率發展,從而左右美元匯價,目前聯儲局關注的就業情況則影響貨幣政策,即美國勞動力市場的表現是影響美匯及貴金屬價格表現的核心因素。至於鮑威爾將於今年5月卸任後,新任聯儲局主席是否必然鴿派,我認為不宜過分期望,除非美國通脹率維持在3%以下的較低水平,而就業市場又明顯偏差,否則,聯儲局貨幣政策亦須在兩者之間取得平衡,大幅減息並非唯一方向。 20日線爭持急跌風險增 現貨金價在2025年最後一個交易日反覆波動,而高位是在亞洲市早段所做的4373.34美元,低位則是歐洲市初段所做的4374.83美元,其後持續攀升至紐約市早段最高4353.7美元,至尾段跌至4304.57美元,最終收在4310美元以上,該位剛好就是我所指的強力支持位。今天在亞洲市以裂口高開後持續上升,但高見4356.23美元後受阻回落。以江恩角度判斷,金價日內傾向在4310至4360美元上落。 從小時圖觀察,以費波納奇擴展線量度,金價的擴展幅度如達100%,則可升至4375.71美元,如反彈12月27日以來最大跌幅之50%,金價可見4412.48美元。換言之,金價仍未能突破4310至4410美元的較大波動範圍。撇除金價向上大幅爆升的可能,金價在本周三收低於日線圖20SMA(現約4348.19),目前仍處於該線以下爭持,故金價快速向下突破的可能性仍然極高,目前日線圖50SMA位於4193美元,而下一級江恩強力支持位則是位於180度角的4210美元,故金價甚有可能下試4210美元後才出現強力反彈浪,惟屆時日線圖20SMA將成為反彈阻力。 以上內容僅供參考,不構成投資建議。 明德特約分析師 鄭廣復
2025-12-31
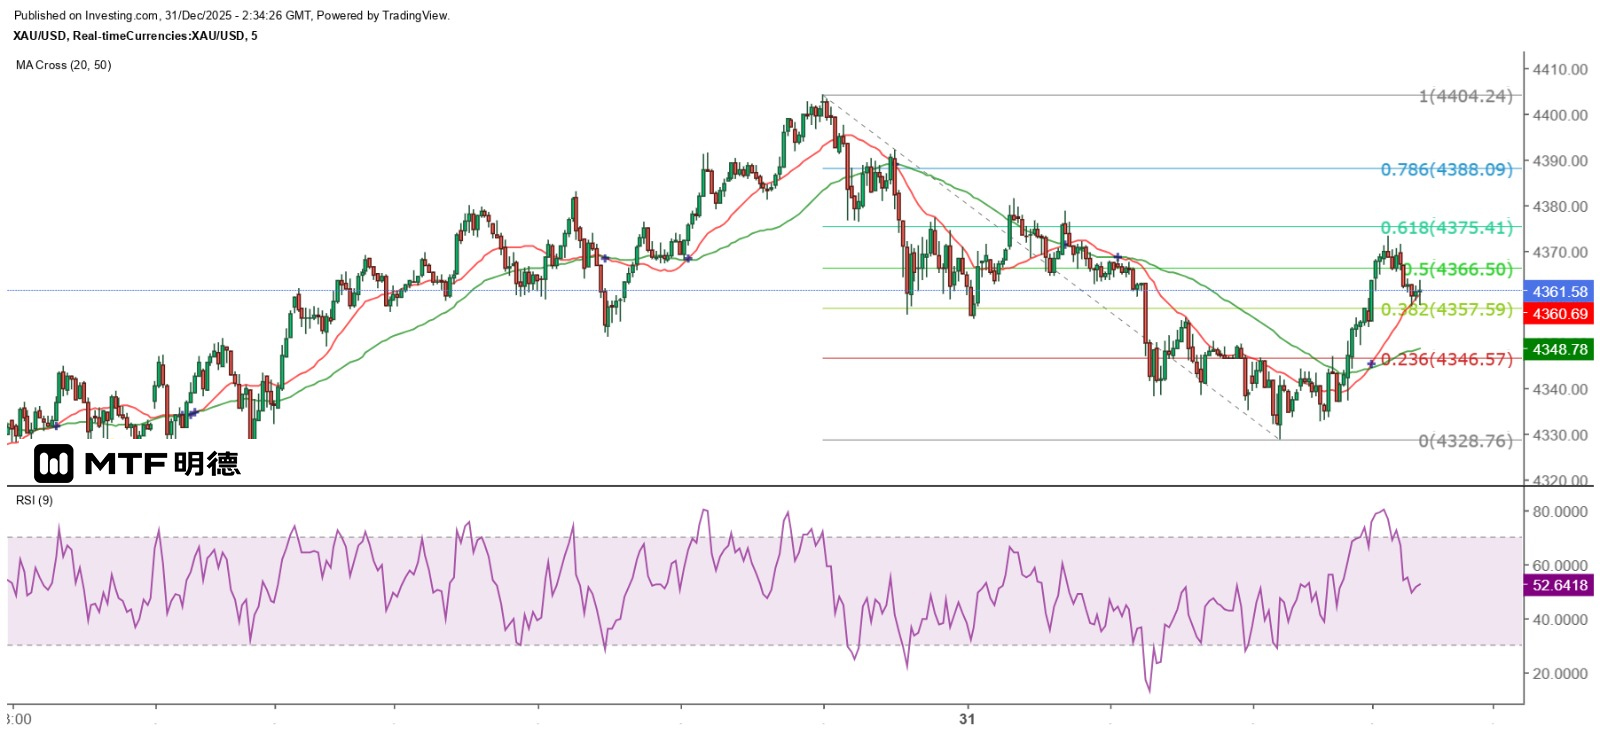
"Gold Price Weak, Beware of Breaking Below 20-Day Moving Average" 31/12/2025 10:33 Completed Yesterday, gold prices held steady above the 20-day SMA on the daily chart (currently around 4336) as expected and then rebounded. However, the rebound was less than 50% of the previous day's range, peaking at 4404.5 dollars before losing momentum and eventually falling sharply to close at 4365.5 dollars. This morning in the early Asian session, gold prices rose again, reaching a high of 4373.34 dollars so far. Technically, gold prices remain above the 20-day SMA on the daily chart. To say that this is a rebound after a strong bearish signal is not entirely accurate. The reason is that I am merely making a judgment based on the candlestick signals and not expressing a personal opinion. However, many investors habitually come up with a hundred thousand reasons to deny the bearish reversal pattern of the candlestick chart last Friday, justifying their continued purchase of gold. This is really unnecessary. Even if I admit that I am going against the market trend, so what? At least I know it's a contrarian move and will be fully prepared for the stop-loss risk. But if you constantly deny the market's signals, you might be denying yourself as a long-term "consumer" of the financial market! Today is the last trading day of 2025. Market conditions could be extremely volatile or very dull. Regarding the trend of gold prices, only a breakthrough above last Friday's high will offer a chance for the upward trend to continue. Investors should note that the movement of gold prices since last Friday is similar to that after the sharp drop on October 21. Therefore, it is necessary to be cautious of a further test of the lower limit after consolidation at the lower limit of last Friday's range. Although gold prices remain above the 20-day simple moving average on the daily chart, if they continue to closely follow this line, it indicates weak rebound strength and a higher possibility of a rapid downward break below this line. Yesterday, the rebound of gold prices only reached as high as $4,404.5, failing to break through the strong resistance level of $4,410 as per Gann's theory. This morning, it dropped to as low as $4,328.76 and then rebounded continuously, rising to a high of $4,373.34, approaching the 61.8% retracement of the biggest decline since yesterday's New York session at $4,375.41. It then fell back to around $4,360 and has been consolidating. Currently, it is more certain that $4,410 and $4,426 have become short-term strong resistance levels for gold prices, while the 20-day SMA and $4,310 are strong support levels. Based on personal experience, short-term trading with 1-minute and 5-minute charts in conjunction with moving averages has a higher probability of success and lower risk. The above content is for reference only and does not constitute investment advice.
2025-12-30
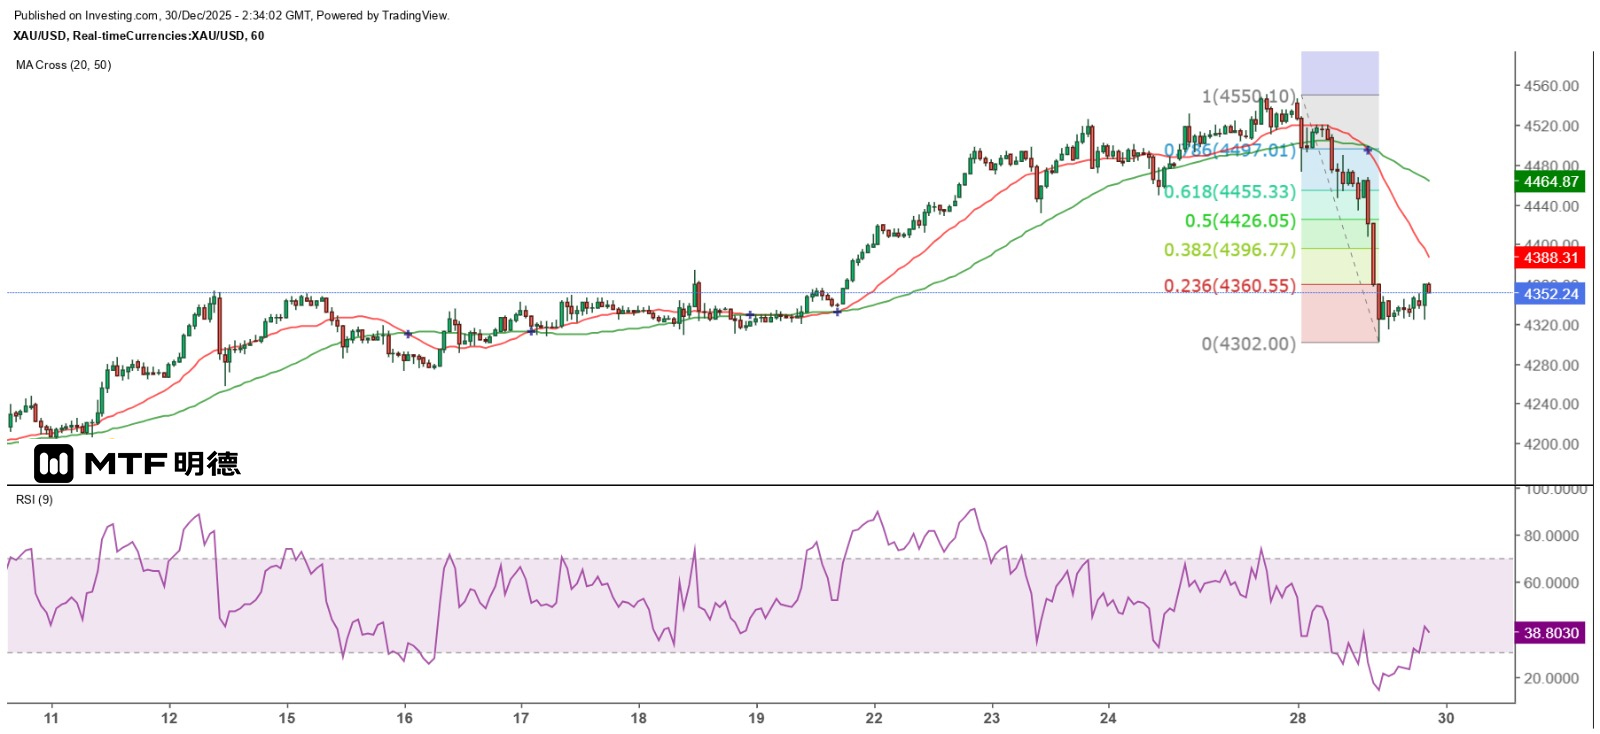
"Gold and Silver Turned Down on the Day, Short-Term Upward Trend Ended" 30/12/2025 10:32 Finalized Yesterday, the prices of gold and silver reversed in a single day and closed in a strong bearish pattern that was nearly a piercing through. In terms of volatility, the gold price dropped by more than 246 US dollars in a single day, the largest decline since the sharp fall on October 21 this year. The silver price fluctuated by more than 7.36 US dollars, the largest ever. Judging from this, the short-term upward trend of gold and silver prices has ended. As of December 29th, this year, the price of silver (3-month silver) has risen by 133.93%, making it the commodity category with the largest increase. The price of gold (2-month gold) has also risen by 55.89%. Given that the 9RSI on the daily chart of gold is still as high as 96 and the RSI of silver has reached 94.6, with both having seen significant increases and remaining in a severely overbought state, if a major correction occurs, there is clearly still a considerable potential for decline. Gold prices hold above the 20-day moving average, indicating potential for a rebound. However, the sharp decline in gold and silver prices yesterday has created a considerable rebound space. From a technical analysis perspective, the stop-loss level for short positions should be set above yesterday's high, but this is obviously impractical. Therefore, the 50% retracement of yesterday's range can be regarded as an important resistance level. Specifically, the short-term rebound resistance for gold is $4,426.93, and for silver, it is $77.085. Additionally, gold tested and briefly broke through the 20-day SMA ($4,328.72) on the daily chart yesterday and this morning, and has not yet fallen below this line, so it can be considered a short-term important support level. Silver, on the other hand, still has some distance from the 20-day SMA ($65.87) on the daily chart. Regardless, at present, it is judged that the gold price may rebound in the short term. However, overall, it is still viewed as ending the upward trend. Investors cannot ignore any downward signals. The gold price is currently expected to fluctuate between $4,410 and $4,310, with the first rebound resistance being the 20SMA on the hourly chart at $4,388.5, which is close to the important resistance level of $4,410 on the Gann Square. The gold price dropped to a low of $4,302 yesterday. As for the silver price, it is currently struggling near the 20SMA on the hourly chart at $73.55, and the 50SMA at $75.16 is expected to offer greater resistance. The above content is for reference only and does not constitute investment advice.
2025-12-29
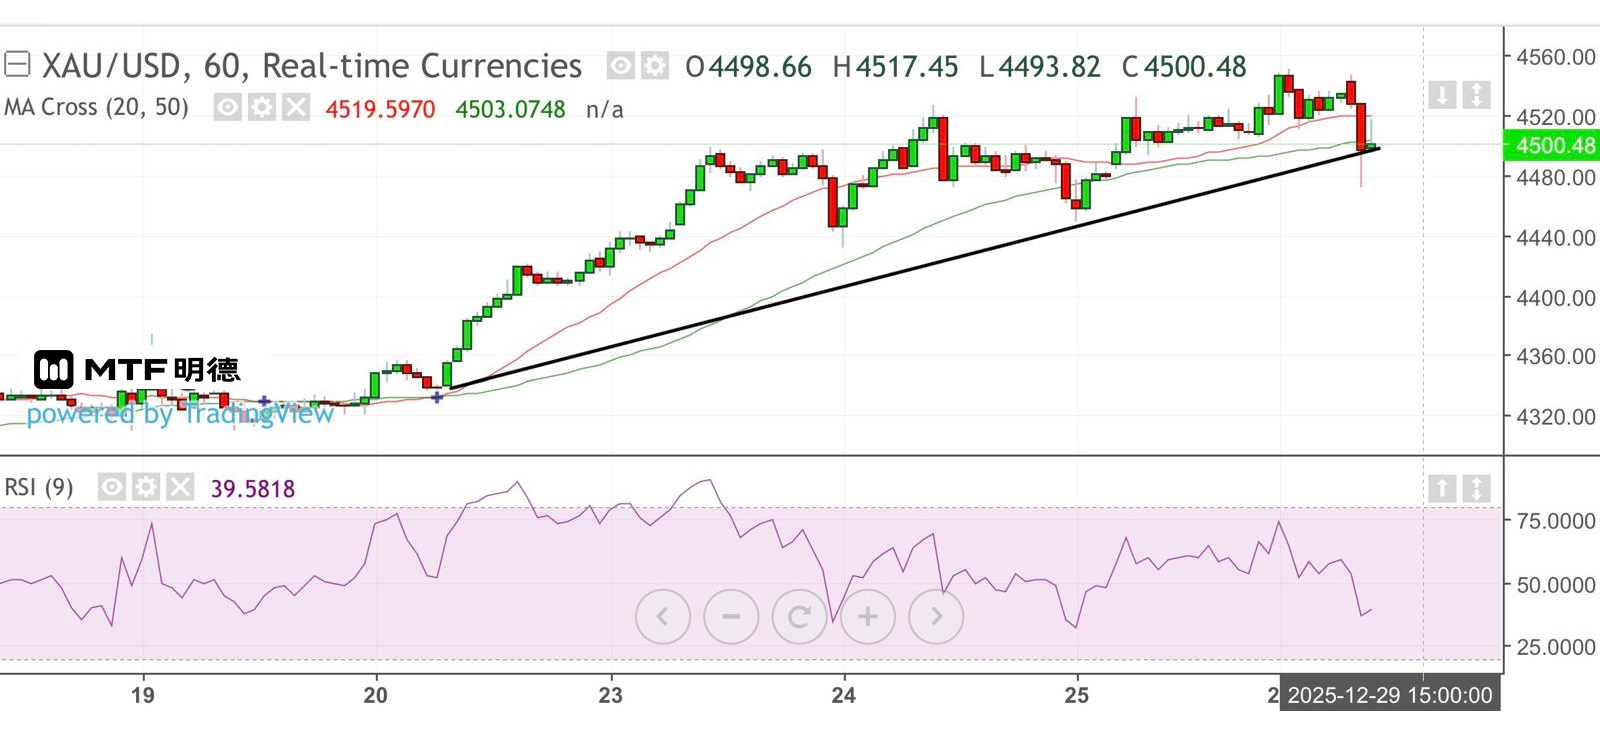
Gold prices are expected to fluctuate at high levels in the short term. 29/12/25 09:26 Finalized. Last Friday, the prices of gold and silver performed strongly. The spot gold price approached $4,550, and the February gold futures even reached as high as $4,584. The increase in silver prices was even greater, with the spot silver price rising by more than 10% in a single day, peaking at $79.3, setting a new historical high. The March silver futures also rose by nearly 7.7%, reaching a high of $79.7. The strong performance of gold and silver prices can be attributed to several reasons. The main factors are the Federal Reserve's interest rate cuts and short-term bond purchases, as well as expectations of further rate cuts in the coming year. Currently, the market anticipates at least a half-percentage point cut in interest rates next year. Additionally, expectations of a dovish monetary policy stance from the next Federal Reserve chair have put pressure on the US dollar, further fueling the rise in precious metal prices. However, the sharp increase of over 10% in the price of silver in a single day has made the price severely overbought. Some market analysts predict that the price of silver could fall to $42 next year. The rally in gold and silver prices at the end of 2025 is indeed unusual and irrational, and a significant correction is not unexpected. A casual friend seems to be taking advantage of the thin trading volume to liquidate his position. On the first trading day after the Christmas holiday, the prices of gold and silver plunged sharply in the early Asian session. Gold opened with a gap up at a high of $4,549 before plummeting. It fluctuated down to the $4,472 level before gradually recovering. From the hourly chart, gold re-entered above $4,500 and the 50SMA ($4,503), but this morning's gap up opening and low closing formed a bearish engulfing candlestick pattern, and a small double top formation with last week's high. Unless the sharp drop this morning was due to short sellers taking advantage of the thin trading volume after the holiday and in the early Asian session to liquidate their long positions, the short-term top of gold prices may have been formed. Gold needs to break through $4,560 to maintain its upward trend. If the gold price can hold above $4,500 again, it is expected to consolidate first within the range of $4,500 to $4,560, and then make an attempt to break through upward. Conversely, if it falls below $4,500, the possibility of testing $4,460 will increase. The fluctuation range this morning has almost covered two Gann angles (4,460 to 4,510 and 4,510 to 4,560). Unless there is a one-sided decline in the gold price, it is highly likely that it will remain within the aforementioned broad range today. The above content is for reference only and does not constitute investment advice.
2025-12-24
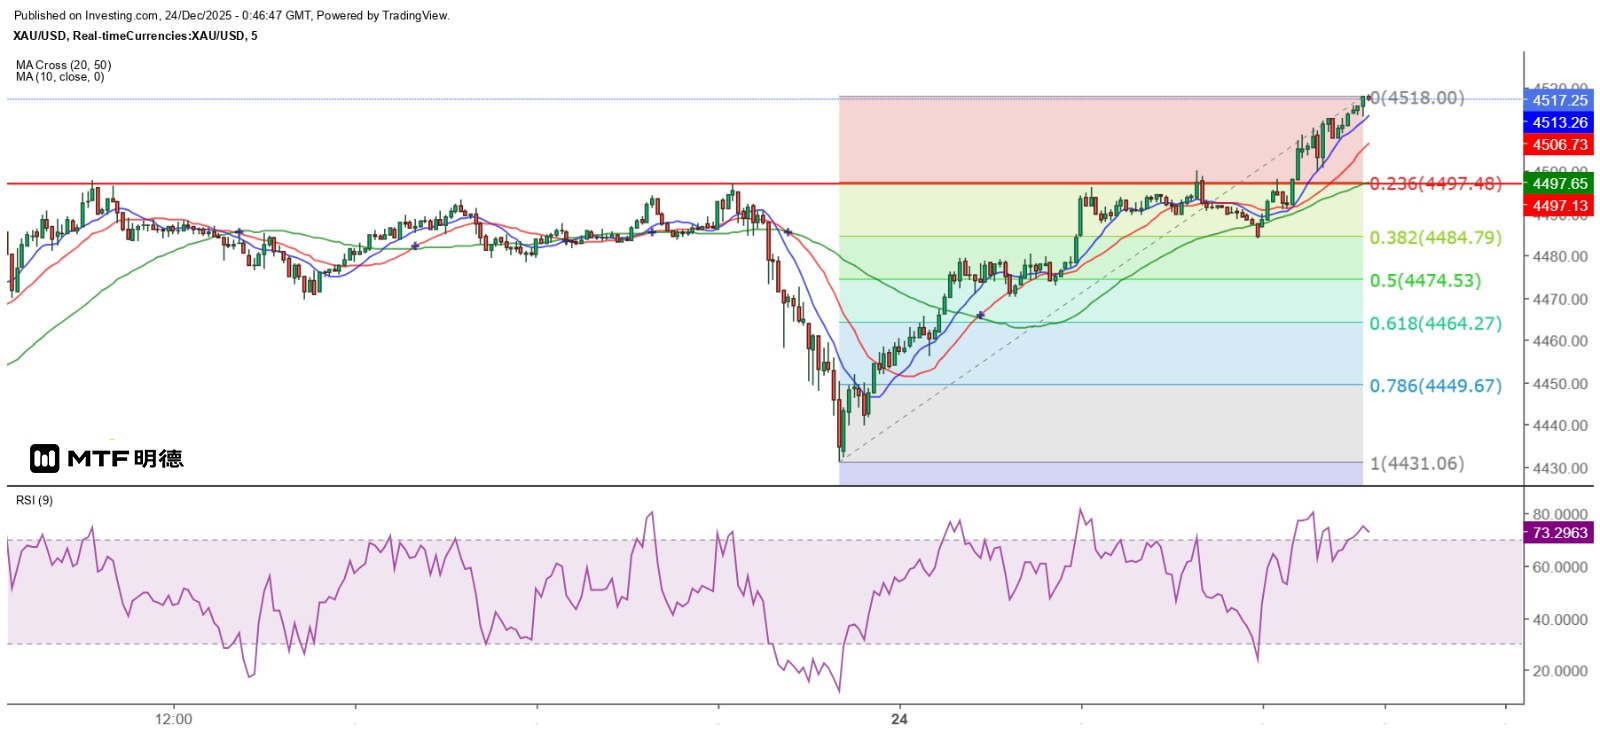
"Gold Price at $4,500 Becomes a Strong Short-Term Support" 24/12/2025 8:45 Completed The market interpreted the sharp rise in gold prices on Tuesday as the escalation of tensions between the United States and Venezuela, as well as the impact of the ongoing Russia-Ukraine conflict, which has not ended in the short term, stimulating the demand for gold as a safe-haven asset. The weak performance of the US dollar also contributed to the increase in gold prices. After reaching the level of $4,497 in the early Asian market yesterday, the spot gold price retreated, briefly fell below $4,470, and then rose again. However, it was blocked at the $4,497 level in the early New York market and then dropped sharply. The main reason is believed to be the acceleration of the growth rate of the US GDP in the third quarter as announced by the US Department of Commerce. Data shows that the annualized growth rate of the US GDP in the third quarter reached 4.3%, higher than the 3.8% in the second quarter and exceeding market expectations of 3.3%. Corporate profits also rose sharply by 4.4% in the third quarter. These figures indicate that the US economy remains strong, reducing the possibility of the Federal Reserve cutting interest rates in the future. As a result, gold prices have come under pressure. CME interest rate futures suggest that the market expects an 86.7% chance that the Federal Reserve will keep interest rates unchanged in January. Yesterday, the spot gold price finally rebounded after hitting a low of $4,431. By the close of the London market, the price had recovered most of its losses and risen above the 20SMA on the hourly chart (4,478.3). Today is Christmas Eve, and the US financial markets will close early. It should be a time when most investors exit the market, and the gold price is expected to fluctuate within a narrow range. However, it is not impossible that someone might take advantage of the earlier malfunction of CME's cooling system, which prevented it from quoting, to manipulate the gold price up and down. But trading volume will definitely decrease significantly, and the volatility of the gold price may thus increase. However, $4,400 is believed to have become a strong support level for gold in the medium term. This morning, gold prices rose further in the early Asian session, breaking through $4,500 and also surpassing the relatively weak resistance at the Gann 315-degree angle of $4,510. This makes it highly likely that $4,500 will become a new strong support level. As mentioned yesterday, the next significant resistance level is at $4,660. Gold prices are expected to fluctuate within a range of $50 to $60 today. Based on the current intraday low of approximately $4,486, gold prices are likely to rise to between $4,536 and $4,546 today. According to observations over a period of time, the 50SMA on the 5-minute chart (currently around $4,496.5) has often provided strong support for gold prices. The unidirectional upward trend of gold prices has already begun. Investors should have a clear strategy in mind! Merry Christmas to all! The above content is for reference only and does not constitute investment advice.

2025-12-23
"Gold Prices Have Launched a New Trend Market" 23/12/2025 10:30 Finalized Gold prices have been surging with great momentum. Spot gold prices have broken through the $4,400 mark and continued to reach new highs. This morning in the Asian market, it hit a high of $4,490.66, approaching the $4,500 mark. This round of gold price rally is closely related to the Thanksgiving and Christmas market conditions. The previous breakthrough occurred on November 28th, right after the Thanksgiving holiday in the United States, when it broke through the descending trend line of the narrowing triangle, which was a clear technical breakthrough. After that, it consolidated sideways and broke above $4,300 on December 12th. It has since consolidated sideways without closing below that level. This time, it has broken through the peak and reached a new high before the Christmas holiday, indicating that it will continue to rise in the first half of next year. From the hourly chart, spot gold prices broke above the top of the sideways range of $4,374.37 since December 12 last Friday and have been climbing along the 10SMA (currently around $4,453). This is the first time I have mentioned the 10SMA because the price of gold often fluctuates around the 10SMA and it has lost its reference value. However, now that the gold price can remain stable and continue to rise below the 10SMA, it reflects a stable upward trend. In other words, closing below the 10SMA on the hourly chart can also be regarded as a signal of a decline. As of now, from the hourly chart, the upward trend after the break last Friday has not yet sent out a reversal signal. This round of the uptrend is heading towards $5,000. Spot gold prices have broken through the important resistance level of 4410 US dollars at the 270-degree vertical angle of Gann. This level will become an important support level for a potential pullback. Yesterday, it was mentioned that there was still a risk of a large double top on the daily chart for gold prices. However, after breaking through the top, no double-day reversal signal appeared within one or two days. Investors are now focusing on the short-term upward breakout trend. Additionally, whether the 9RSI still shows a double top divergence remains to be seen. Currently, the 9RSI corresponding to the previous top is 89.87, while the current 9RSI is 88.93, indicating a divergence still exists. Conversely, if the 9RSI breaks above the previous value, the divergence will disappear, and the pullback in gold prices will only be based on its overbought condition. Judging from the current trend, $4,410 and $4,400 are important support levels for gold in the short term. $4,510 is at a 315-degree angle, so it is not a strong resistance level. The first strong resistance level is at $4,660. Further upward movement will encounter resistance at $4,810 at a 45-degree angle, but the resistance is also relatively weak. The next resistance level is at $4,960, as it is at a 90-degree angle, so the resistance is greater. At the same time, it is also close to the $5,000 mark, so the bulls and bears are expected to have a fierce battle. Currently, gold has entered a new trend market, which is relatively easier to operate. The above content is for reference only and does not constitute investment advice.
2025-12-22
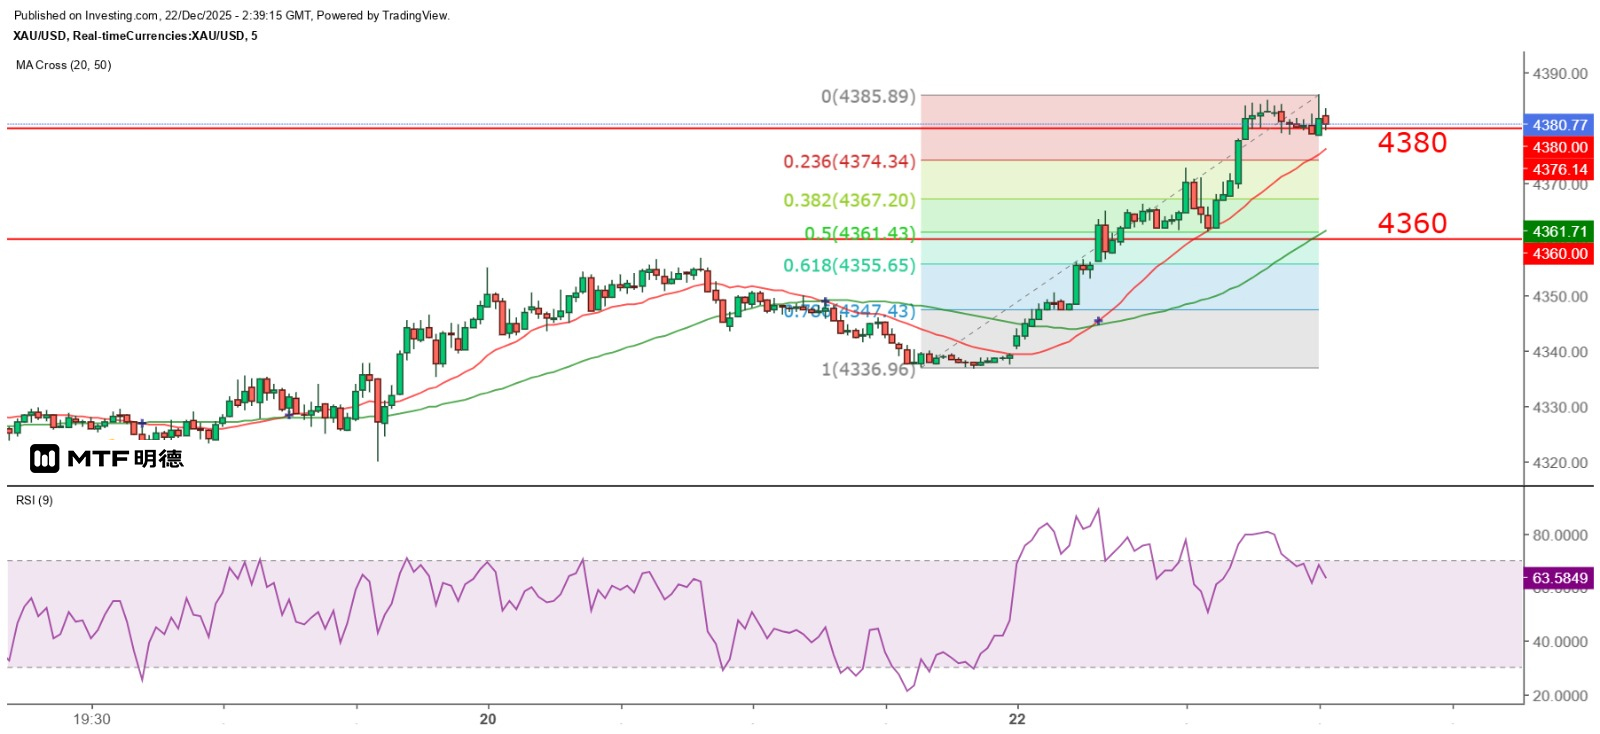
"Gold Price Must Stay Above 4,400 to Maintain Uptrend" 22/12/2025 10:29 Finalized This morning, the spot gold price finally reached a new historical high, rising to a peak of $4,385.04, and then consolidated above $4,380. The silver price, which had already hit a new high in October this year, continued to climb, reaching a high of $68.81 this morning. The market expects that the further interest rate cuts by the Federal Reserve are the main driving force. It was pointed out long ago that the high gold-silver ratio needed to be adjusted. There are three possible scenarios for the performance of gold and silver prices. Currently, both gold and silver prices are rising continuously, and the silver price is rising at a faster rate, causing the gold-silver ratio to decline. Therefore, the silver price can be regarded as an indicator of the gold price. However, investors should be aware that the 9RSI on the monthly chart of silver has approached 94, while that of gold has exceeded 96, indicating that both remain at extremely overbought levels and are at risk of a significant correction. Although an overbought market can become even more overbought, this does not mean it can be ignored. When the market suddenly recognizes that gold is severely overbought and needs to adjust, the price of gold could drop by over a hundred dollars. Investors without stop-loss orders or those overly optimistic would face the risk of substantial losses. Therefore, investors should adhere to their original trading rules. Regardless of whether the gold price reaches new highs, they should operate based on the upward and downward signals and should not suddenly increase their positions. Although the gold price has reached a new high, it has made the double top pattern on the daily chart more obvious. For the gold price to rise further, it must break through the $4,400 mark and remain above it. Only then will more investors believe that the gold price has bottomed out at the $4,400 level and has more room to rise, driving the gold price up further. This morning, the strength of the gold price reaching a new high was not strong, and there was no large amount of buying after that. It is estimated that the Christmas holiday is approaching, and the market has already left the scene, causing the fish and shrimp to become arrogant in the water. It is expected that the short-term range will fluctuate around 4380. The intraday performance of gold prices will depend on the market opening in Europe. If gold prices rise strongly and reach a new high then, it is expected to break through the $4,400 mark. However, $4,410 is located at the 270-degree vertical angle of Gann's theory, which presents relatively strong resistance. Moreover, the liquidation activities before the Christmas holiday will make it difficult for gold prices to rise. If gold prices close above $4,400 before the Christmas holiday, the possibility of further climbing in the future is relatively high, and it may quickly challenge the $4,510 mark. On the contrary, gold prices may have the opportunity to retest $4,380 or even fall to $4,360 before finding support. With the holiday approaching, the sparse trading volume will cause gold prices to fluctuate aimlessly. $4,380 is expected to be the level where gold prices shuttle back and forth. The above content is for reference only and does not constitute investment advice.
2025-12-19
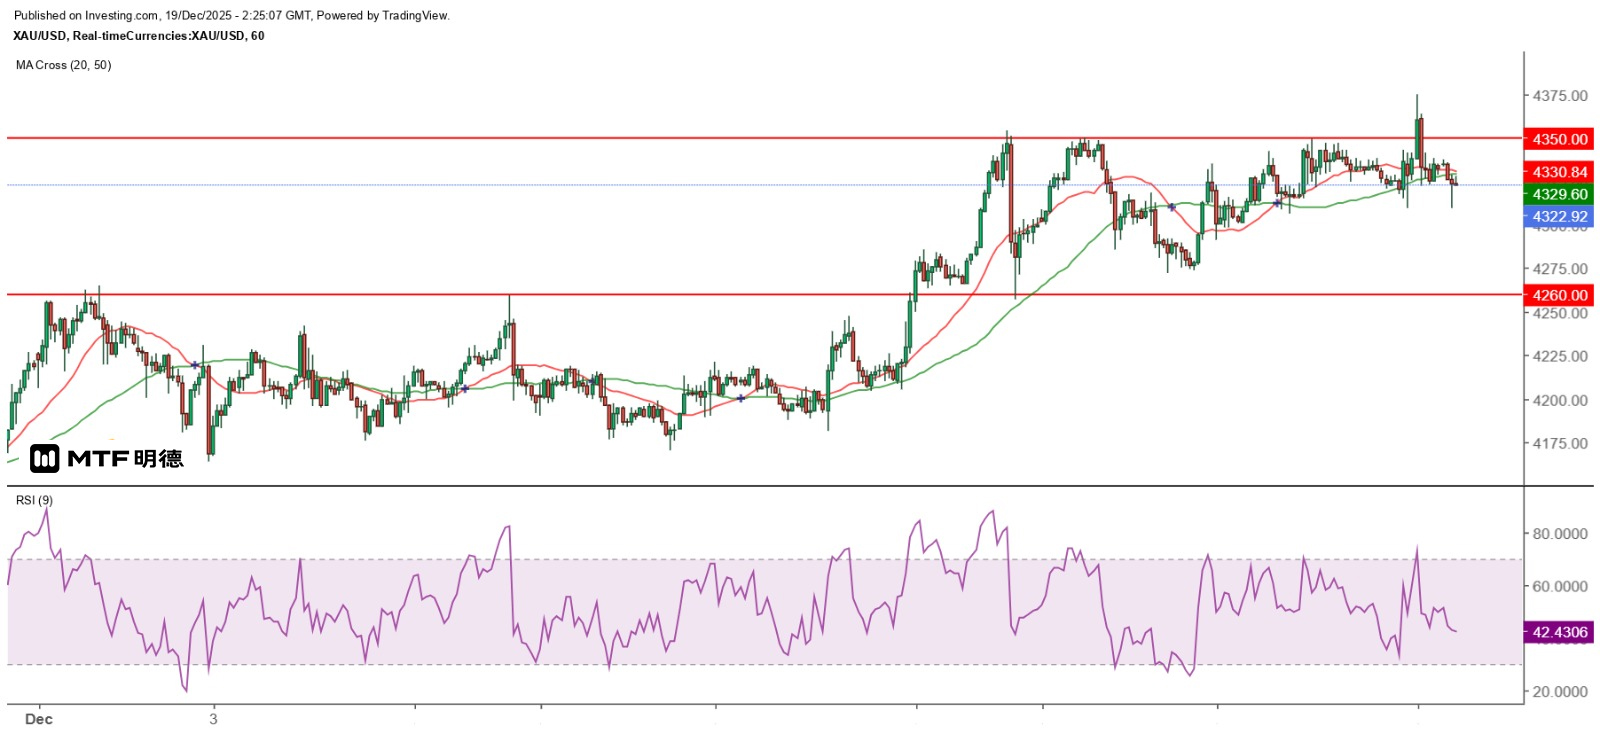
"Gold Price Forms a Large Double Top, Future Outlook Worrying" 19/12/2025 10:23 Completed Yesterday, the United States released data showing that the year-on-year increase in the CPI in November slowed sharply by 0.3 percentage points to 2.7%, and the year-on-year increase in core CPI also dropped sharply by 0.4 percentage points to 2.6%. Investors may think this reflects a rapid slowdown in US inflation, increasing the chances of further interest rate cuts by the Federal Reserve. In fact, the sharp drop in the CPI increase in November was to some extent affected by the earlier shutdown. The US Department of Labor pointed out that due to the shutdown, it was unable to collect data for October, and some of the indices used for calculation relied on non-survey data sources. Survey data only resumed on November 14th. Therefore, I believe that the CPI in December will be closer to the actual situation. Especially considering the Thanksgiving effect in November, even if the CPI increase was not significant, it should not have dropped sharply. Yesterday, the volatility of gold prices intensified. I believe that many investors suffered losses, mainly because they suddenly expanded their risk appetite several times over, setting stop-loss levels far from the market price after seeing the potential for gold prices to reach new historical highs. Affected by the sharp drop in the US November CPI increase, the spot gold price fluctuated significantly in the early morning of New York and then continued to rise. It reached a high of $4,374.37 in London, very close to the historical high of $4,381. However, it then dropped rapidly and hit a low of $4,309.52 this morning before gradually recovering. This formed a double bottom with the low of $4,309.23 in the early morning of New York yesterday. The chance of a break below 4,300 increases significantly. First, from a broad perspective, the gold price approached the historical high but failed to break through, instead experiencing a significant decline, forming a large double top on the daily chart. Additionally, from the hourly chart, the gold price dropped sharply after the London market closed, causing the candlesticks to show a double-line decline and a bearish signal. Moreover, the bottom of the large bullish candle on Wednesday was breached twice, although it eventually closed above it. This indicates that the support level of $4,315.29 is no longer strong. Furthermore, the gold price has now fallen below the 20SMA ($4,318) and the 50SMA ($4,310.5). Based on this, the probability of a major correction in the gold price has significantly increased. The $4,300 level is almost certain to be breached, and $4,000 will be the medium-term target for a test. In the short term, it is expected that the gold price will fluctuate below $4,335 within the day and is highly likely to test $4,260. If this level is breached, the gold price is likely to further test the lower-level Gann strong support level of $4,210 in the future. The above content is for reference only and does not constitute investment advice.

2025-12-18
"Gold Price Set to Show Breakthrough Movement" 18/12/2025 10:28 Finalized The gold price movement yesterday could be roughly divided into three parts. It continued to rise in the first half of the Asian session, then dropped to a low level and moved sideways in the European session. After the opening of the New York market, it rose again and then fluctuated at a high level. The spot gold price reached a high of $4,348.81 yesterday, but failed to reach the first upward target of $4,352.09 mentioned yesterday. From the hourly chart, the gold price has encountered resistance near $4,350 three times since last Friday. This morning, it even broke through the 20SMA ($4,330.7). Does this indicate that the gold price is preparing to launch a major correction wave before the Christmas holiday next week? Judging from the short-term cycle, today is a turning point for gold prices, meaning a peak has been reached and a decline is expected, with a tendency to gradually test the low of last Friday at $4,257.34. However, yesterday, gold prices rose sharply in the early New York session, climbing from $4,315.1 to a high of $4,343.96, and this morning's low was only $4,324.54. In other words, yesterday's strong upward candle still supports the upward trend of gold prices. Therefore, what needs to be watched first is whether gold prices can continue to hold above the 20SMA on the hourly chart. If they close below this line for three consecutive hours, the risk of a decline will increase. Secondly, whether the bottom of the aforementioned strong upward candle will be breached. If it closes below its lowest point, it will also be regarded as a signal of a decline. Only then should the short-term cyclical trend of gold prices peaking and falling be considered. Since the short-term cyclical trend indicates that the gold price will peak and fall today, has the top already emerged or is it about to form? Therefore, in addition to the above pessimistic considerations, investors must also be mentally prepared for the possibility that the gold price may break through yesterday's high, or even the top of the large sideways range of $4,353.7 since last Friday. If it does break through, it will be a strong breakout signal, and the judgment that the gold price will peak and fall today will not hold. Instead, the gold price's trend before the Christmas holiday is likely to rise further. The recent repeated fluctuations of the gold price at high levels can also be seen as a sign of energy accumulation for a possible upward breakthrough. The above content is for reference only and does not constitute investment advice.
2025-12-17
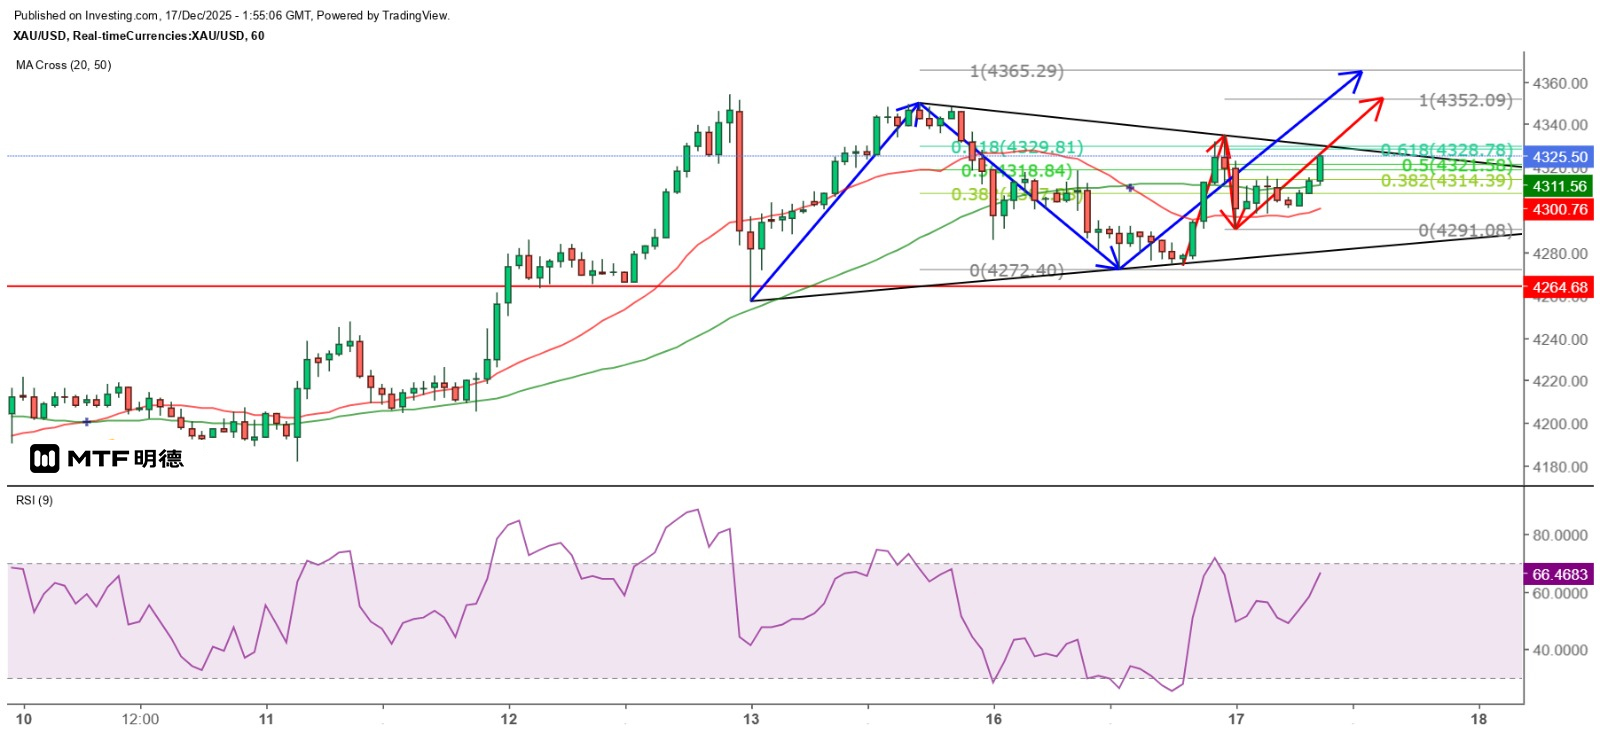
"Gold Prices Likely to Break Out of Narrowing Triangle" 17/12/2025 9:50 Completed The U.S. non-farm payroll rose by 64,000 in November, exceeding expectations. However, the unemployment rate rose by 0.2 percentage points to 4.6%. The market believes that the employment report reflects a deterioration in the labor market, but I don't think this is a deviated employment report. A careful examination of the sub-items of the employment report shows that the overall labor force in the U.S. decreased by 323,000 in November compared to September, while the number of unemployed people increased by 228,000. Clearly, the numerator increased while the denominator decreased, so the quotient must be larger. The US job market has not deteriorated. On the other hand, the report shows that the number of people re-entering the labor market in November was 2.618 million, an increase of 293,000 from 2.325 million in September. This is often interpreted as an increase in job opportunities and a sign of optimism about the economic outlook. The duration of unemployment also supports this view. The number of people unemployed for less than five weeks increased by 316,000, while those unemployed for five to 14 weeks decreased by 165,000 and those unemployed for 15 to 26 weeks decreased by 101,000, indicating that job seekers generally found employment relatively quickly. Additionally, the average weekly working hours increased from 34.2 to 34.3, and the average hourly wage rose from $36.81 to $36.86. Therefore, a rise in the unemployment rate alone is not sufficient to prove that the job market has deteriorated. Yesterday, the spot gold price rose to a high of $4,318 in the early Asian session and then continued to decline. The intraday low was $4,272.4, which was reached half an hour before the European market opened. After that, it rebounded steadily and reached a high of $4,292.09 half an hour after the European market opened. It then declined steadily, hitting a low of $4,273.99 before rebounding. It formed a double bottom with the low made before the European market opened. Eventually, it rose to $4,335 before adjusting and hitting a low of $4,291.08. It briefly tested the high made in the early European session before rising again. Resistance is expected at $4,360 on Thursday. From the hourly chart, the gold price has been moving in a narrowing triangle since last Friday in New York. Measured by the Fibonacci extension line from the broader range of movement, the 100% extension level could reach $4,365.29. If measured from the low of yesterday's European midday at $4,273.99, the 100% extension level would be $4,352.09. Therefore, the current question is whether the gold price will continue to rise or start a correction wave. Gold prices fluctuated repeatedly yesterday and closed near a doji pattern, remaining firmly above $4,300. This morning in Asia, prices continued to rise, not only holding above $4,300 but also breaking back above the significant resistance level of $4,310, which is the 180-degree point on the Gann Square. They have continued to reach new intraday highs up to $4,325.39. It is estimated that the previous day's high of $4,335 will be the first important resistance today. If this level can be broken, gold prices should be able to further challenge $4,352 and $4,365. However, it should be noted that $4,360 is another Gann angle, although not a significant resistance, it lies between the two major challenge targets and cannot be ignored as a resistance. The above content is for reference only and does not constitute investment advice.


