
 en-US
en-US 

 Telegram
 WeChat

2025-12-16
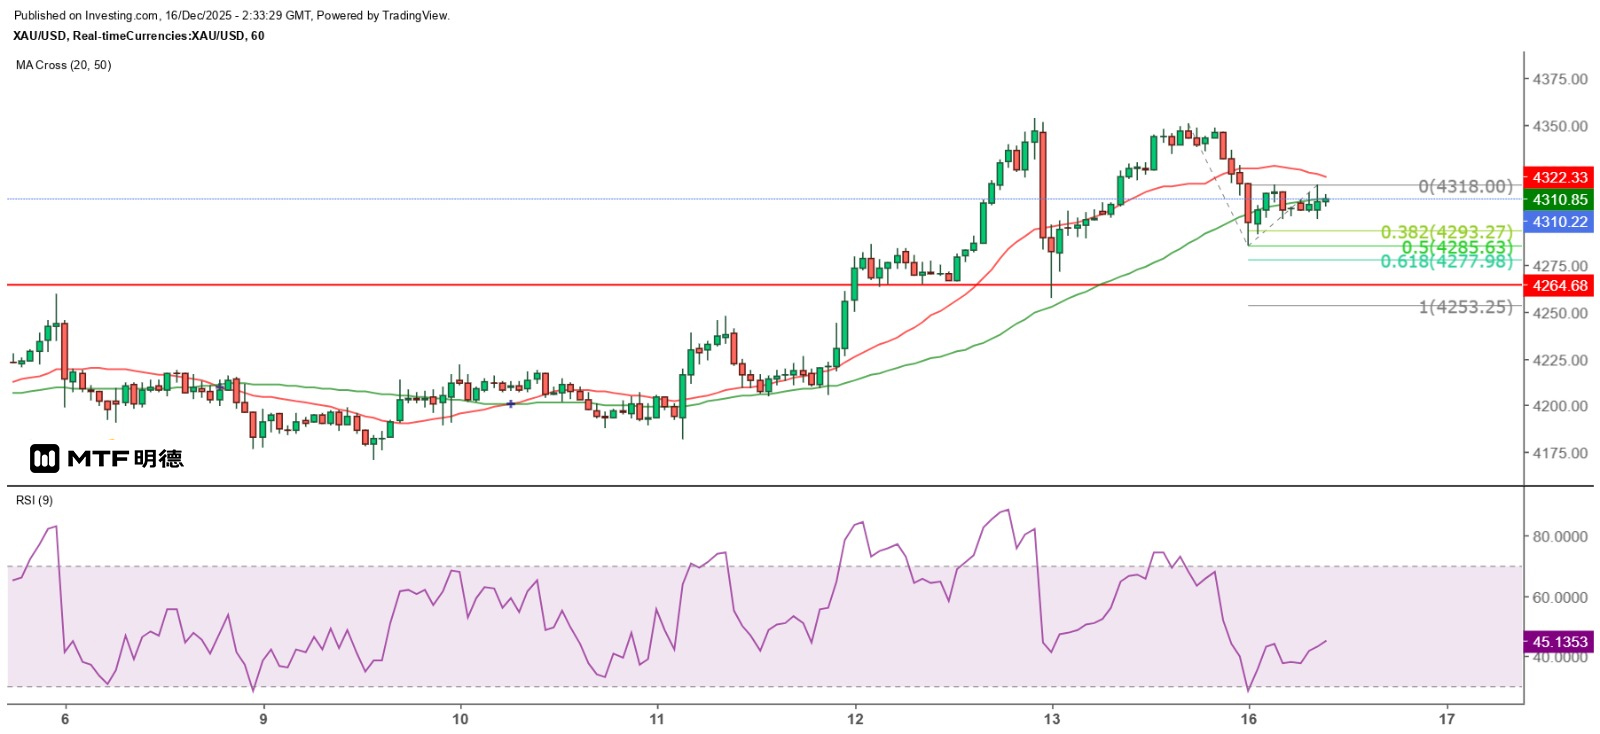
"Gold Prices Form Double Top, Short-Term Selling Pressure Increases" 16/12/2025 10:32 Finalized Yesterday, the gold price indeed formed a double top pattern on the hourly chart. As the European midday approached, the spot gold price reached a high of $4,350.23 and closed with a bearish candle. The subsequent rebound only reached $4,348.31 before a rapid correction began. The price dropped to $4,285.48 at the close of the London market before rebounding. However, this morning's high of $4,318 failed to reach the top of the large bearish candle at the close of the London market, which was $4,318.92. Although the gold price has been fluctuating at a high level, it has remained above $4,300, indicating that the upward trend of the gold price has entered a new stage. In the short term, the risks to consider are that the gold price has broken below the 20SMA (4322.3) on the hourly chart and has closed below the 50SMA (4310.8) for several hours, and has not been able to recover the top of the large bearish candle formed at the close of the London market yesterday. Secondly, the US Department of Labor will release the November non-farm payroll report tonight. Currently, the market predicts that the increase in non-farm payroll positions will be between 40,000 and 50,000, which is far less than the new positions added in September. However, the risk is that the number of jobs "increases" rather than "decreases". If the market's focus is on the direction of US interest rates, this is undoubtedly a bad data. But if the focus is on the fundamentals, the fact that the number of jobs continues to increase should not be regarded as a poor data. Another more important factor is that for Americans, Thanksgiving is more significant than New Year's Day. November retail sales should be relatively good. As such, the market has an excuse to push up the US dollar exchange rate and sell off non-US currencies and gold. However, I would like to emphasize that this is a risk consideration and not a bearish view on gold prices. But it is expected that gold prices will be more volatile today! In the short term, I am more concerned about the impact of the double top formation on the gold price in the hourly chart, and it seems that it has already broken through the 20 and 50-hour SMAs, facing the risk of further decline within the day. From the perspective of the double top pattern, $4,285.48 can be regarded as the neckline. Therefore, if it is broken, the measured decline target is $4,217.26. On the other hand, if the Fibonacci extension line is used to measure the movement since yesterday, if the amplitude reaches 100%, the gold price will fall to $4,253.25, slightly lower than the top of the previous large horizontal range in the hourly chart at $4,264.68, as well as the low point made at the close of the London market last Friday at $4,257.34. For the time being, it is judged that the risk of further decline in the gold price is relatively high. It is expected that the 20-hour SMA ($4,322.4) will be the first important resistance for a rebound. Only after breaking through and holding above it can it be expected to challenge the double top resistance. The above content is for reference only and does not constitute investment advice.
2025-12-15
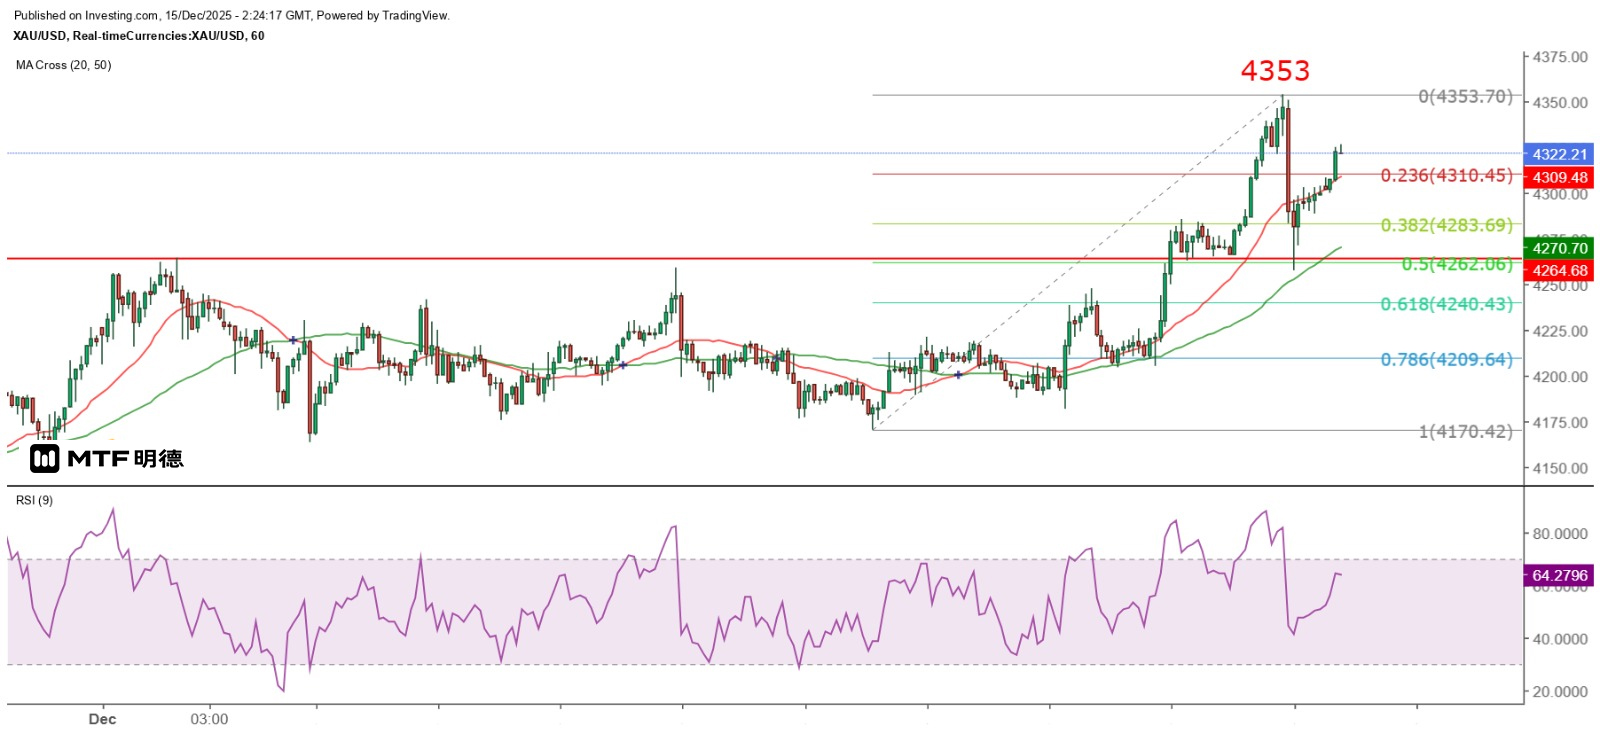
"Gold Price Stabilizes at 4,300, Optimistic Outlook" 15/12/2025 10:23 Finalized Gold prices remained strong last Friday. The spot gold price held above $4,264 in the early Asian session and then started to rise in the afternoon. It showed a strong one-sided upward trend after the European market opened. The upward trend continued after the New York market opened, reaching a high of $4,353.70. However, it dropped sharply before the London market closed, hitting a low of $4,257.34, and then gradually recovered, closing above $4,300. Gold prices rose steadily last Friday, a move that was not driven by ordinary investors but rather by the market's accumulation. However, if ordinary investors have the courage to follow, they can also gain substantial profits under the protection of the market. As for the sharp drop before the London close, it was likely caused by liquidation orders. But gold prices still rebounded by more than $40 from the day's low to close in the New York afternoon session, indicating that the upward momentum of gold prices has not waned. Non-farm payroll data is expected to add momentum to gold prices. I still believe that the strong rise in gold prices is due to the dovish signals sent by the Federal Reserve - cutting interest rates and halting balance sheet reduction. On the other hand, the employment report closely watched by the Federal Reserve will be released tomorrow. Some financial institutions predict that non-farm payrolls will increase by 40,000 in November, far lower than the 119,000 in September, while the unemployment rate is expected to remain at 4.4%. This is already sufficient to provide a basis for further gains in gold prices. The spot gold price reached a temporary high of $4,323.03 in the Asian market this morning, with a low of $4,300.12, indicating that the price has formed a strong support at $4,300. Additionally, as the gold price has broken through the 180-degree strong resistance of the Gann Square at $4,310, it is expected that the price will fluctuate between $4,310 and $4,360 in the short term. Of course, given the current strength of the gold price, the probability of challenging the historical high of $4,381 and even breaking through $4,400 to set a new record high is extremely high. Gold at $4,353 has a double top risk. From the hourly chart, it can be seen that the gold price dropped sharply before the London close last Friday, slightly testing the top of the large sideways range but not breaking through the 50SMA (currently around 4270.7), and ultimately closing above the top of the sideways range. In the short term, the important support levels for the gold price within the day are $4310 and $4300. Even in the most pessimistic scenario, it is expected that there will be support around the top of the aforementioned large sideways range at approximately $4265. Additionally, it should be noted that if the gold price approaches $4353 or slightly breaks through this level, there is a risk of a double top. However, the current judgment still leans towards a gradual upward trend. Under these circumstances, investors only need to operate based on technical signals and do not need to make unnecessary guesses. Confidence or fear will only have a psychological impact on you and have no influence on the trend of the gold price at all! The above content is for reference only and does not constitute investment advice.
2025-12-12
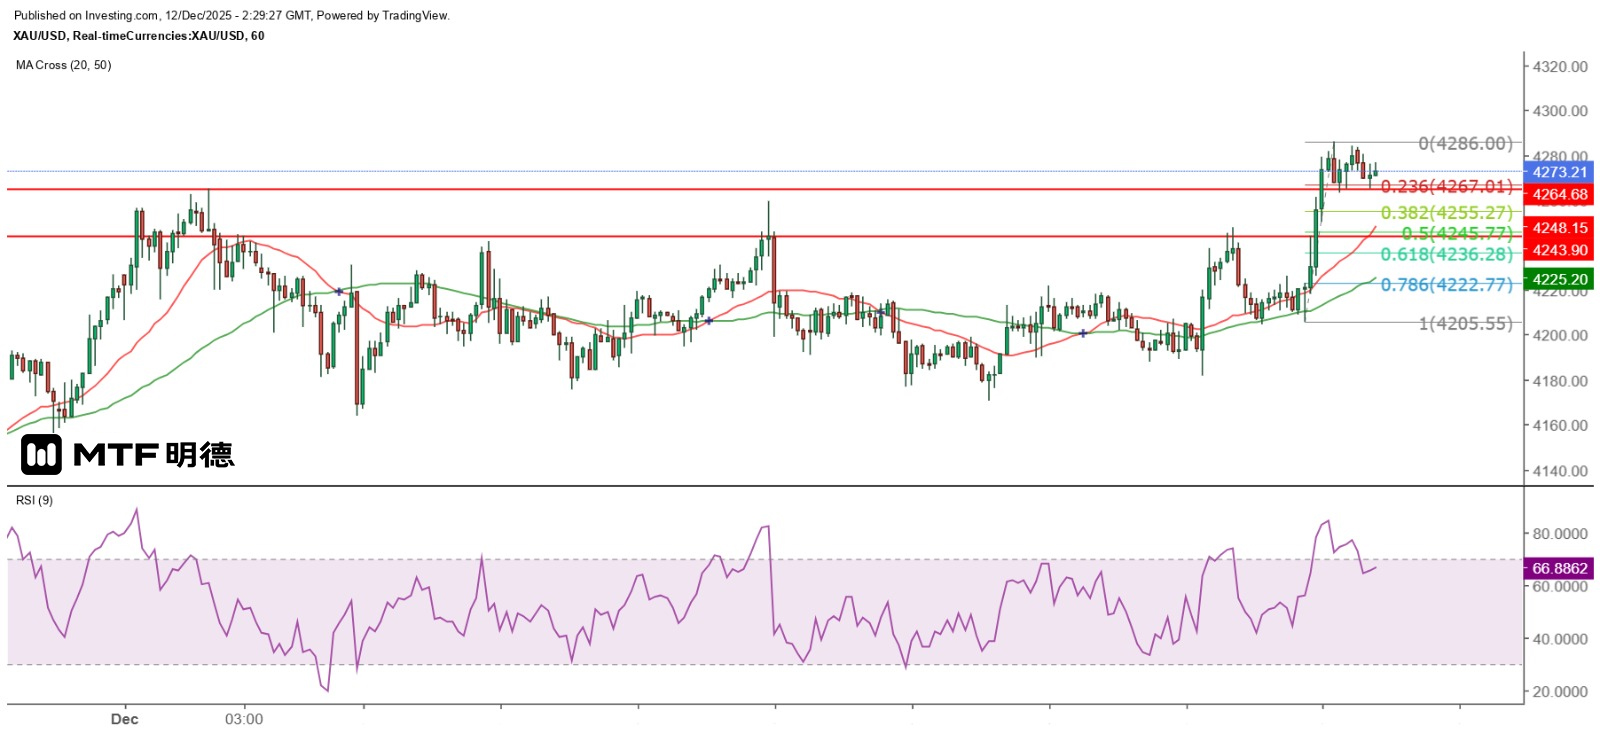
"Gold Prices Break Out of Large Consolidation Zone" 12/12/2025 10:26 Finalized Yesterday, the gold price performed stronger than expected. Although the spot gold price dropped sharply from the Asian market high of $4,247.79 to a low of $4,204.42 at the opening of the European market, it gradually rebounded. However, it was blocked at the high of $4,226 in the midday of the European market. At the opening of the New York market, it fell to a low of $4,205.55. But just like at the opening of the European market, the gold price turned upward within one hour. Subsequently, the upward trend was intense. Not only did it break through the Gann angle at $4,260 and the head and shoulders bottom measurement target of $4,268 on the hourly chart, but it also reached the short-term resistance zone of $4,286 in the early afternoon of the New York market. The gold price then closed with a long bearish candle on the hourly chart, which was a piercing pattern. It would be no surprise if a new high is reached within the year. Although the highest price of gold in Asian market today was only $4,283.84, which failed to break through yesterday's high, the pullback was relatively small. A careful observation shows that after the long bearish candlestick with a lower high and lower low yesterday, gold did not enter a sustained correction phase but consolidated above $4,260. From the hourly chart, spot gold has broken through the high of $4,264.68 made on December 1st. The lows in New York yesterday and in Asian market this morning were $4,263.31 and $4,264.9 respectively, which are very close to the above-mentioned price. Therefore, it can be inferred that the upward trend of gold has entered a new stage and a new round of upward wave is about to break out. It is not surprising that it will set a new historical high in the remaining time of this year. If gold breaks through $4,400 and holds above that level, the upward trend in early next year will be even stronger! The range from 4260 to 4245 is a strong support zone. From the perspective of Gann Square, the key support level for gold price within the day is $4,260. As previously analyzed, it is unlikely that the gold price will fall below $4,260. If the bulls want to maintain control of the overall situation, $4,260 must not be lost. To take a step back, $4,245.77 is the next level of support, which is the 50% retracement level from yesterday's New York low to this morning's high. However, if the closing price today is below $4,260, it will weaken the strong upward trend of the gold price. For the time being, it is judged that the gold price will consolidate above $4,260, and the possibility of challenging $4,310 within the day is very high. It is believed that the adjustment range within the day is extremely limited, and the range from $4,260 to $4,245 can be regarded as a strong support zone. The above content is for reference only and does not constitute investment advice.
2025-12-11
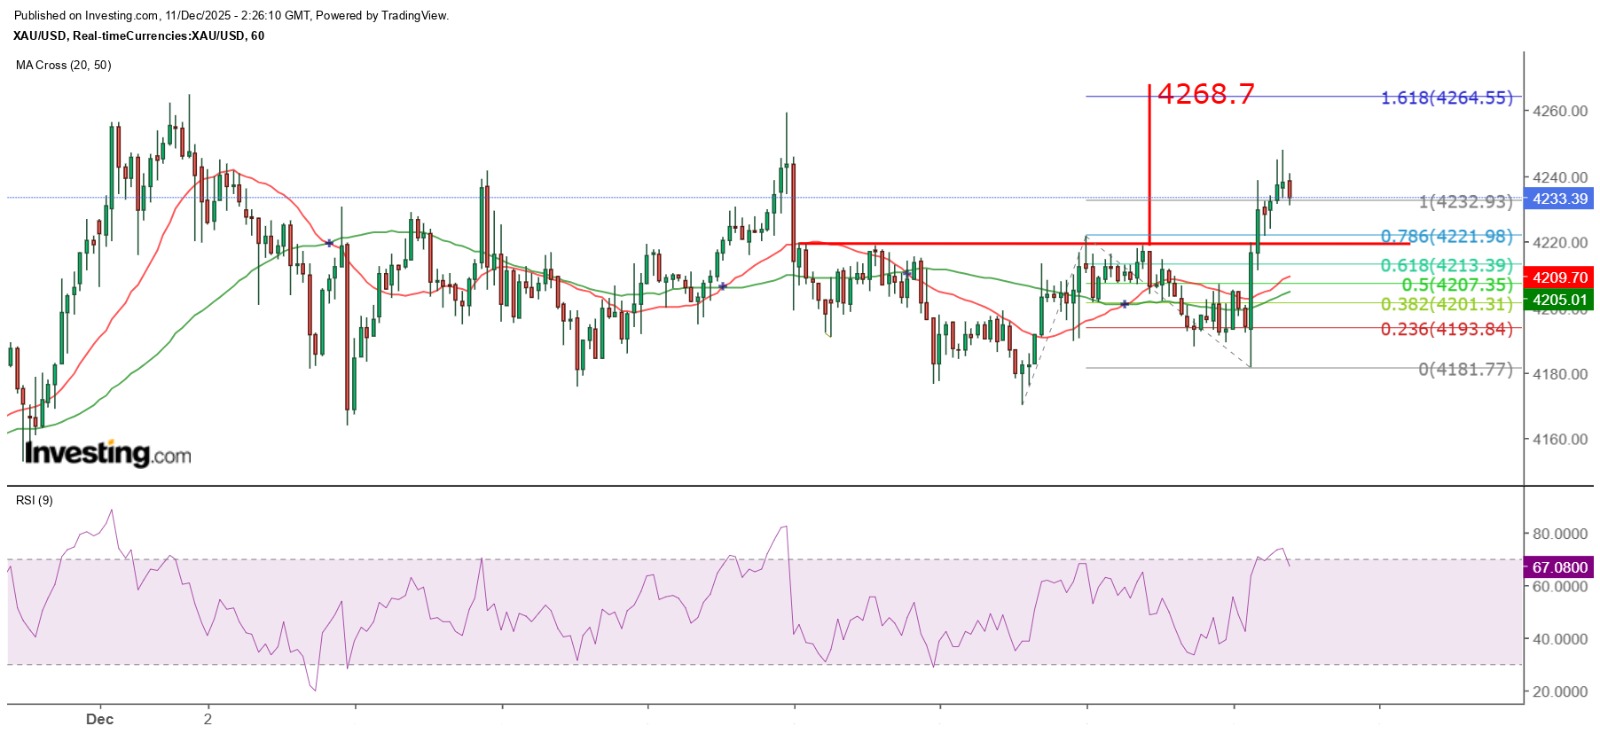
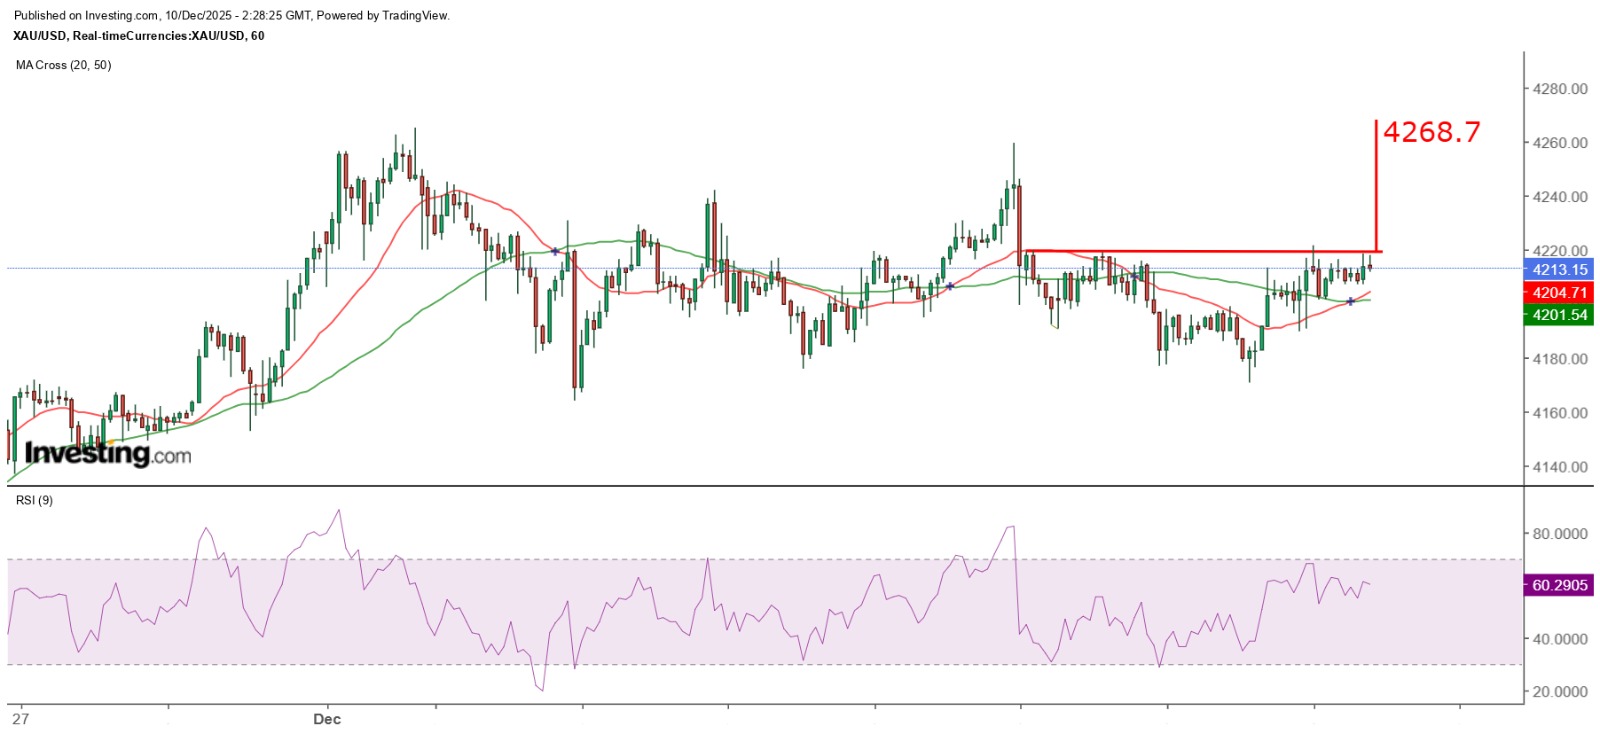
"Gold Prices Expected to Consolidate at High Levels Before Breaking Out" 11/12/2025 10:24 Finalized The Fed's interest rate decision pushed gold prices to break through upward. As expected by the market, the Fed decided to cut interest rates by 25 basis points after the interest rate meeting, lowering the target range of the federal funds rate to 3.5% to 3.75%, and planned to purchase short-term bonds to maintain the size of its balance sheet. However, the decision to cut interest rates this time was not unanimous. Miler suggested a half-point cut, while two other committee members advocated keeping the interest rate unchanged. The Fed's interest rate cut and bond purchase program have pushed up the price of gold. In the latest economic forecast, the Federal Reserve has slightly raised its growth forecast for this year from 1.6% to 1.7%, and significantly increased its forecast for next year from 1.8% to 2.3%. However, it has maintained its unemployment rate projections at 4.5% for this year and 4.4% for next year. Regarding inflation, the authorities have lowered their PCE inflation forecast for this year from 3% to 2.9%, and for next year from 2.6% to 2.4%. As for interest rates, the authorities expect the median federal funds rate target range to drop to 3.4% next year and to 3.1% in 2027. In other words, there will be two 25 basis point rate cuts in the next two years. However, such long-term forecasts are often revised in light of changes in the US economy and global situation, so investors can take the long-term interest rate target of 3% as the ultimate level. $4,220 is expected to be short-term support. The Federal Reserve's interest rate cut and purchase of short-term bonds have stimulated the rise of gold prices. The spot gold price has risen sharply from $4,193 to nearly $4,220, then fluctuated and fell, hitting a new intraday low of $4,181.77 before rising sharply again. At the end of trading in New York, it rose to $4,238.67 and then pulled back to find support at $4,221.67. After consolidation, it rose again and reached a high of $4,247.79 in the early Asian session today. As the gold price has broken through the neckline of the head and shoulders bottom pattern mentioned yesterday and closed above $4,220 on the hourly chart, it is likely to test the Gann angle at $4,260 in the short term, as well as the measured upside target of the head and shoulders bottom pattern at $4,268.7. However, another risk factor to consider is that since the market already knows the Fed's monetary policy is dovish, there is no need to chase gold at relatively high levels. Instead, it is advisable to operate within a broader comfort zone to increase profits. The short-term support level is at $4,220, but $4,200 is likely to be a level that bulls will defend. The $4,300 mark or another important Gann angle at $4,310 is expected to be a short-term resistance. If bulls are preparing to launch a new offensive, they must accumulate positions again. Therefore, it is likely that the gold price will consolidate between $4,200 and $4,300 for a period of time, waiting for the opportunity to break through. In this case, the support zone for spot gold is expected to be between $4,200 and $4,220, while the resistance zone is likely to be between $4,280 and $4,300. The above content is for reference only and does not constitute investment advice.
2025-12-10
"Gold Price Above 4200 Reorganizes Uptrend" 10/12/2025 10:22 Finalized Yesterday, the spot gold price dropped to a low of $4,170.42 in the early European session before rebounding. It remained above $4,200 until the opening of the New York market, where it briefly fell below $4,200 but stabilized at around $4,190. It rose to a high of $4,221.58 by the close of the London market, and although it fell back again, it held above $4,201.65 and continued to climb. It reached a high of $4,216.17 in the late New York session. Today, it dropped to a low of $4,207.07 in the early Asian session before surging. It was twice held back at around $4,218 but remained above $4,210. The performance of gold prices in the late New York session yesterday and the early Asian session today was clearly different from that on Monday, suggesting that speculators have begun to position themselves for the Federal Reserve's interest rate decision tonight (3 a.m. Thursday). From the daily chart, it can be seen that the price range of gold expanded yesterday and formed a bullish candle with a higher high and lower low. Optimistically, it is expected that gold prices will break through $4,260 as previously predicted and then challenge $4,310. Yesterday's low did not touch the 20-day moving average on the daily chart (currently around $4,154), and it also fell below the low of the breakout candle on November 28 ($4,157), but of course, this did not send out a signal of a downturn. The hourly chart shows a head and shoulders bottom. From the hourly chart, it can be seen that the gold price plunged sharply with a large bearish candle after the London close last Friday. Since then, all the rebounds have failed to close above $4,220. However, the pattern is gradually forming a head and shoulders bottom, with $4,219.56 being the neckline. Therefore, based on the measurement of the range, if the gold price clearly breaks through and closes above $4,220 on the hourly chart, the upward target would be approximately $4,268.7, which is slightly higher than the Gann angle of $4,260. For the time being, the first important support level for spot gold is $4,210, followed by $4,200. The possibility of the gold price testing below $4,210 is still high, but the probability of it falling below $4,200 seems low. The above content is for reference only and does not constitute investment advice.
2025-12-09
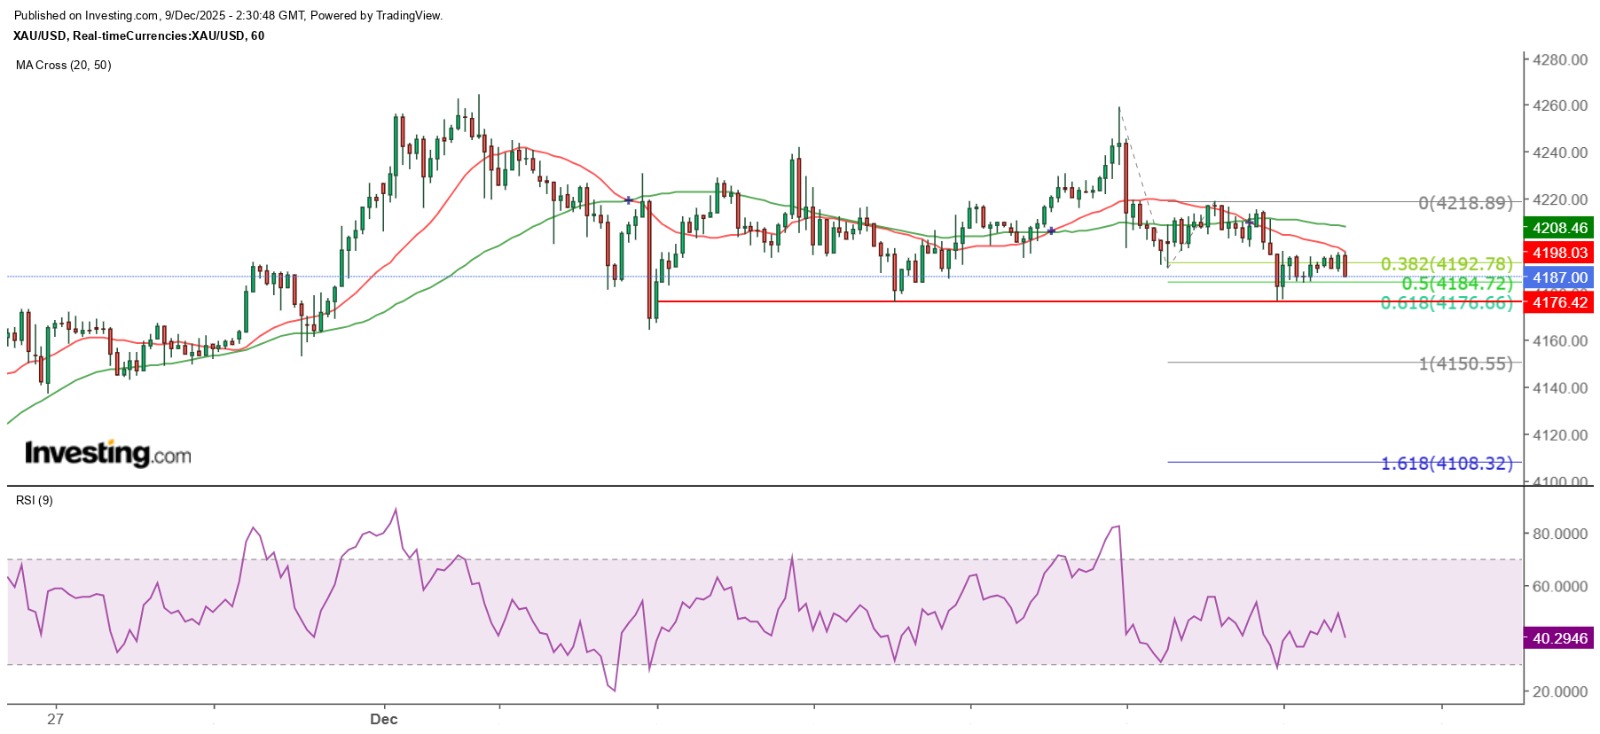
"Whether Gold Price Will Fall Below 4,200 Remains to Be Confirmed" 9/12/2025 10:28 Finalized Yesterday, the gold price remained within a narrow range. A close look at the daily chart of spot gold shows that it rose to $4,259.55 last Friday, but then dropped sharply, closing in a shooting star pattern. Yesterday, the gold price failed to break above last Friday's high, but its low was lower than last Friday's low. The price remained sideways throughout the day, with a range of about $43. This market condition is more suitable for short-term traders who take advantage of the ups and downs, but it is a disaster for those who prefer to trade in a one-way market, such as swing traders or trend followers. Since the gold price broke through the descending triangle's lower trend line on November 28th, even though its intraday performance has been highly volatile and directionless, it has still managed to rise above $4,200. Currently, I am pondering a question: Has the gold price already fallen below $4,200? If the answer is yes, then the strategy would be to short sell when the price approaches $4,200 from the lower side, and also to take selling at higher levels as the main approach. Conversely, if I remain optimistic about the gold price's future and believe it has the potential to break through $4,200 and even reach new highs, then I would refrain from taking any action when the price approaches $4,200 from the lower side. Instead, I would buy when a buy signal is triggered above $4,200. Since the Asian market opened today, the gold price has failed to rise above $4,200, giving a sense that it has indeed fallen below this level. However, it is also evident that the gold price has become more volatile than before. In other words, it is still uncertain whether the gold price has truly broken through the $4,200 mark. Even though the market had already factored in the possibility of a rate cut by the Federal Reserve after its interest rate decision on Thursday morning, the gold price could still experience rapid ups and downs, and only after a double-sided movement would it enter a one-way market. From the hourly chart, the recent pattern of each wave of gold price being lower than the previous one is quite obvious. After a sharp drop from the $4,215 level in the early part of New York yesterday, the current trend shows a descending flag formation. There is a risk that the lower end of the sideways range since last Thursday, at $4,175, could be breached. If so, the possibility of gold testing the Gann angle at $4,160 would increase significantly. Currently, the 20-day SMA on the daily chart is around $4,152, which is expected to be the first important technical support level for the recent gold price adjustment. However, if gold manages to test this level and breaks below the low of November 28th, and closes below $4,157.15, or even below the 20-day SMA for three consecutive trading days, the possibility of gold further testing $4,110 would increase! The above content is for reference only and does not constitute investment advice.
2025-12-08
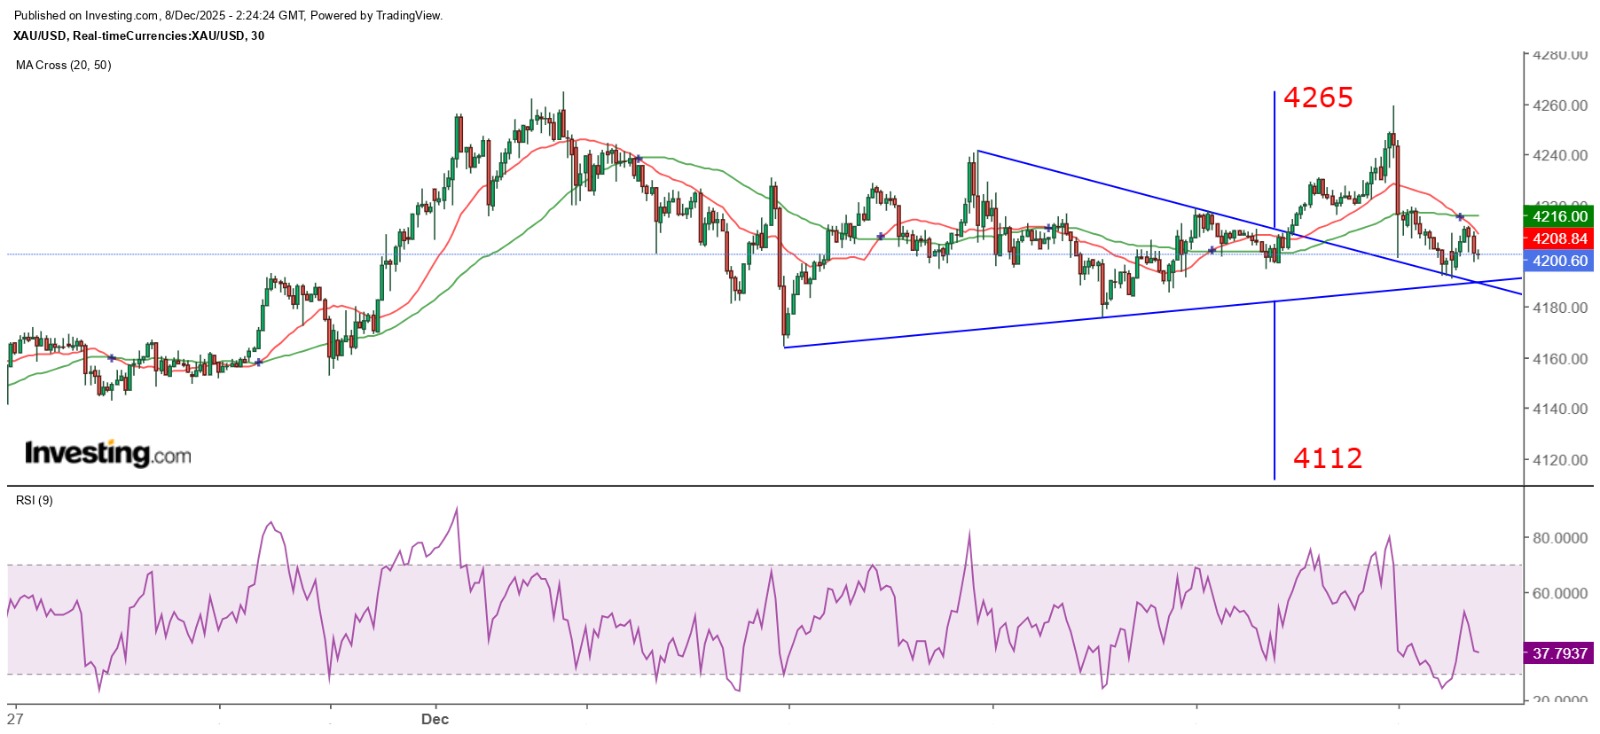
"Three Possible Performances of Gold Prices Before the Interest Rate Decision" 8/12/2025 10:21 Completed Last Friday, the gold price staged a dramatic reversal. The spot gold price maintained an upward trend after the midday trading in Tokyo but plunged sharply about half an hour before the London market closed, hitting a high of $4,259.18 and then falling below the $4,200 mark within half an hour. It rebounded slightly but was capped at around $4,220 and then dropped again, closing at $4,197. From the daily chart, it can be seen that the gold price approached $4,265 on December 1st but was blocked and fell back. On November 13th, it rose to the $4,245 level but closed lower on the same day. It has since continued to decline. Last Friday, it was also blocked at around $4,260 and then dropped sharply. For the time being, it can be judged that the $4,250 to $4,265 range is an important resistance zone for the spot gold price. In other words, a breakthrough above $4,265 will open the door for the gold price to set a new historical high. Multiple factors have led to a sharp drop in gold prices. Gold prices were quite volatile in the Asian market this morning, hitting a low of $4,190.84 before rebounding and reaching a high of $4,211.75. However, it later retraced to test the $4,200 level again, where it seems to be experiencing a stalemate between bulls and bears. From a daily chart perspective, gold prices showed a single-day reversal pattern last Friday but remained above $4,157.15, thus not sending out a clear bearish signal. Instead, it has maintained a sideways pattern. From a 30-minute chart, gold prices broke out of the descending triangle in the midday Tokyo session last Friday, but then dropped sharply before the London close and even fell further this morning. However, it still held above the extended support level of the descending trend line. From a more optimistic viewpoint, last Friday's single-day reversal could be seen as a correction after the breakout, especially as gold prices are approaching the high of December 1st, posing a double top risk. Friday was also the last trading day of the week, with many positions being closed, leading to a strong pullback in gold prices. $4,200 remains a key support level. In the short term, gold prices must first hold steady at $4,200 before having another chance to reach a peak. Secondly, at 3 a.m. this Thursday, the Federal Reserve will announce its interest rate decision. The market expects a 25 basis point cut with a probability of 88.4%. There are three possible strategies for the market regarding this interest rate meeting. The optimistic strategy is to push gold prices to a high level and wait for the announcement. However, the risk is that the Fed may keep interest rates unchanged or support a rate cut with a smaller margin. A pessimistic or more extreme strategy is to push gold prices to a lower level, or even trigger a sell signal, and then sharply raise the price when the Fed announces a rate cut. In this case, all speculators who bought gold in advance expecting a rate cut will be wiped out, and retail investors who are bearish and fail to exit in time will also be eliminated. The gold price may also fluctuate within a range of 100 dollars around 4200 dollars, and then make a unilateral breakthrough after the interest rate decision is announced. My view is that you should not follow the trend only when the price fluctuation reaches 40 to 50 dollars. Moreover, only short-term operations are advisable this week. Do not assume that the gold price will enter a unilateral trend market just because of favorable or unfavorable US economic data, and ignore the risk that short-term reversal signals may bring! The above content is for reference only and does not constitute investment advice.
2025-12-05
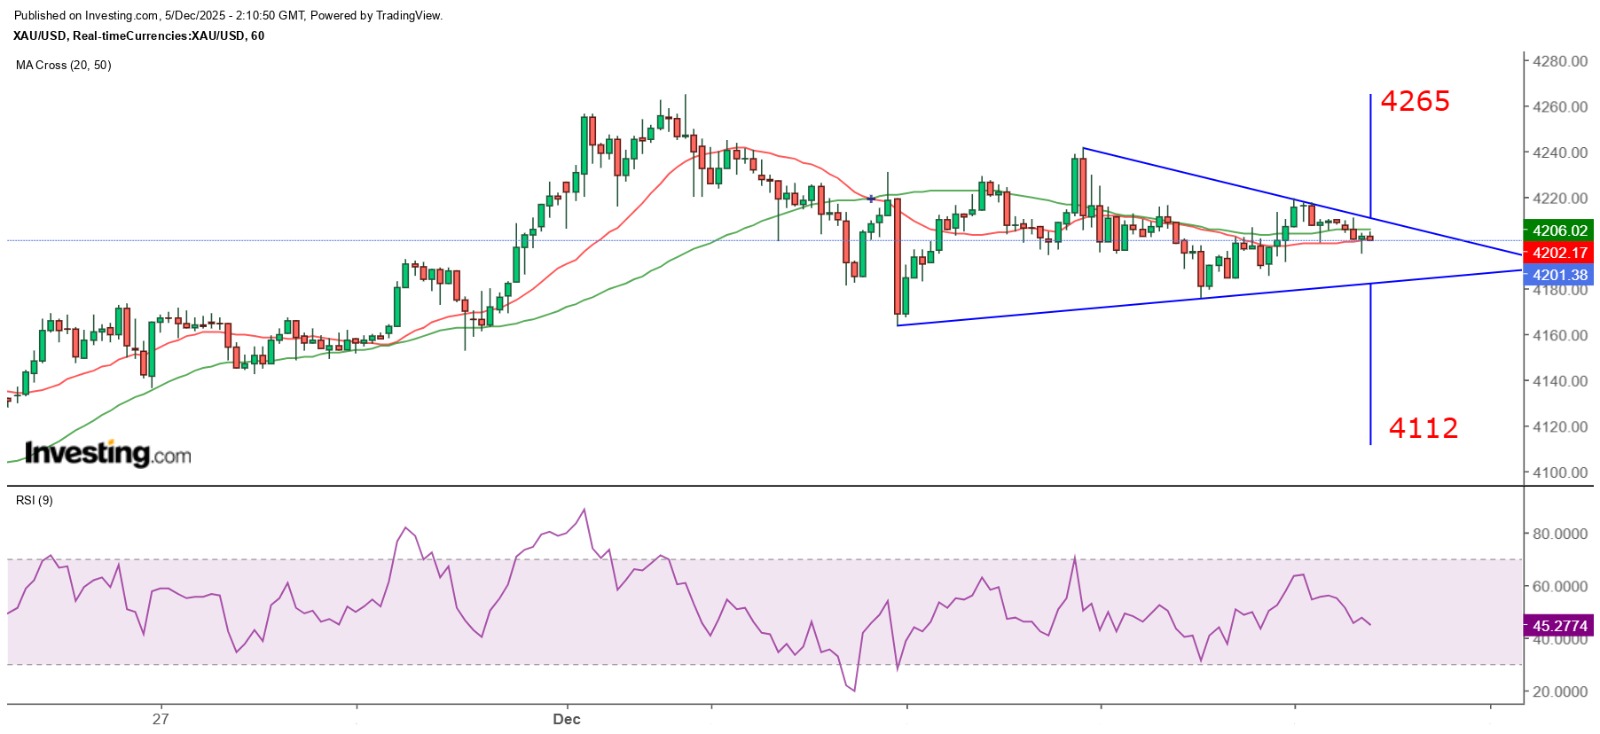
"Gold Prices Build Momentum to Challenge $4,310" 5/12/2025 10:09 Completed Yesterday, the gold price maintained a fluctuating trend. Assuming that the Federal Reserve will cut interest rates by 25 basis points next week, the recent fluctuation in the gold price is partly due to speculators taking advantage of the volatility to make profits and accumulate strength for a large-scale move next week. Secondly, it is easier to control the price trend by keeping the gold price within the recent fluctuation range. Yesterday, the spot gold price hit a low of $4,175.84 before the European market opened and gradually rebounded. It reached a high of $4,219.27 at the close of the London market before falling again. This morning in the Asian market, it hit a low of $4,194.9 and then rebounded, temporarily rising above $4,200. Therefore, the spot gold price has basically remained within the Gann angle range of $4,210 to $2,160, and the resistance at $4,210, which is at a 90-degree angle, is indeed very strong. However, from the perspective of the daily chart, the intraday fluctuations of gold prices this week are completely undetectable. $4,200 is likely to be a strong support before the interest rate decision. Gold prices rose sharply last Friday and broke through the descending triangle's lower trend line. This week, they have generally shown a sideways trend and formed an ascending flag pattern. Today is the last trading day of the week. It is estimated that speculators will start to push up gold prices on Monday next week, or even today. The high is likely to occur on Wednesday next week, and 4,200 US dollars is very likely to become a strong support before the interest rate decision next week. The possibility of falling below this level is very low. In other words, the spot gold price is likely to fluctuate between 4,210 and 4,260 US dollars, and it is highly likely to challenge the next strong resistance level of 4,310 US dollars next week. Measured by the TD line, if the gold price breaks above the descending triangle's lower trend line on the hourly chart, the measured target is approximately $4,265. If it falls below the upper trend line, the measured target is $4,112. However, given the gold price's repeated fluctuations this week and its potential to rise back above $4,200, coupled with the growing market expectation of the Federal Reserve cutting interest rates, the possibility of a breakout to the upside is relatively high. The above content is for reference only and does not constitute investment advice.
2025-12-04
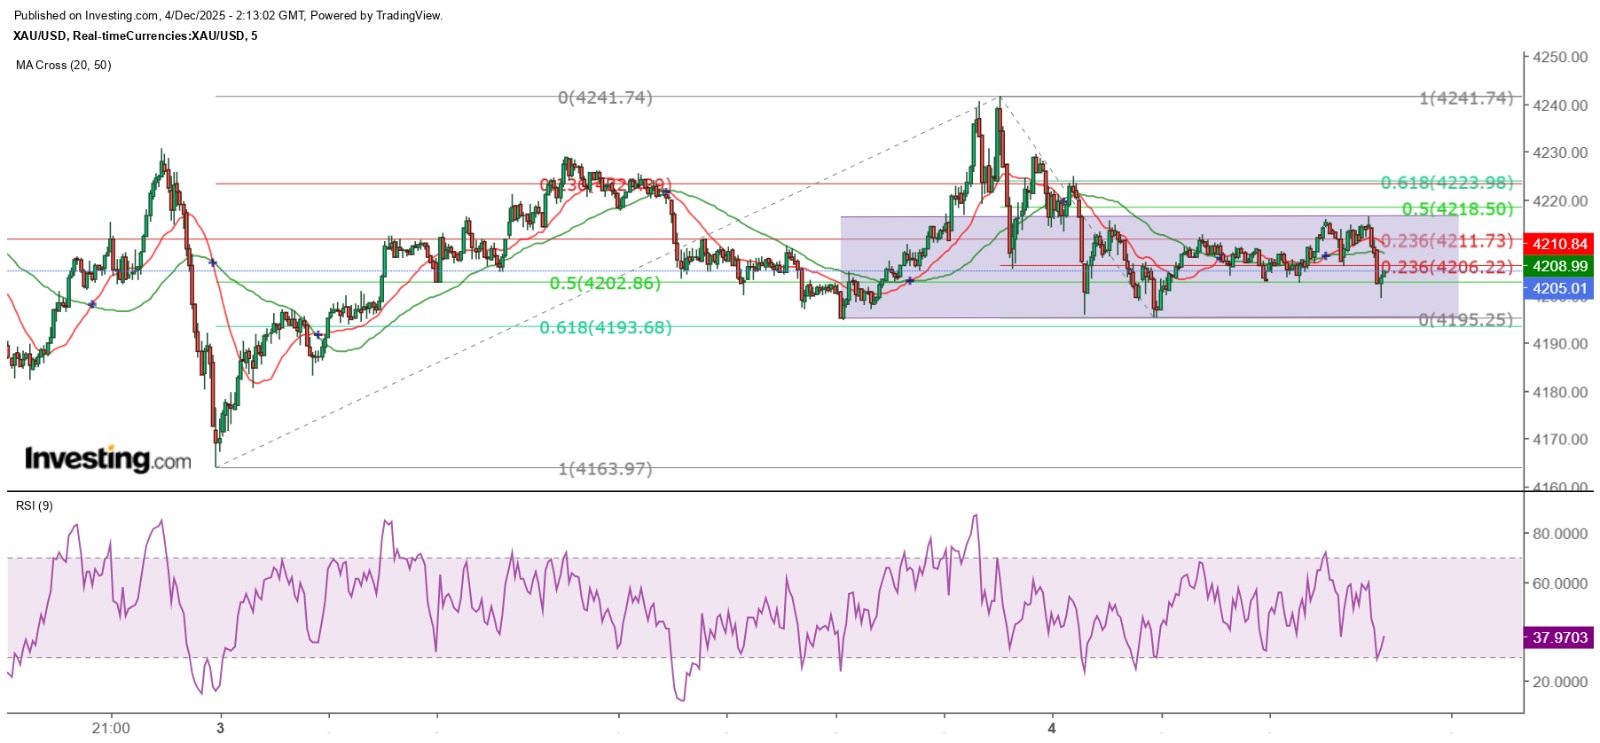
"Gold Price Surges but Remains Steady at 4,200" 4/12/2025 10:11 Finalized Yesterday, ADP announced that the number of private sector jobs in the US decreased by 32,000 in November. This was seen by the market as a basis for the Federal Reserve to likely cut interest rates this month. After the data was released, the spot gold price rose from the $4,211 level, reaching a high of $4,240.59 before falling sharply to $4,232.95. It then rose again, eventually reaching a high of $4,241.74 before plummeting. The price then fluctuated downward, hitting a low of $4,195.25 in the New York midday session before gradually recovering. This morning, it gradually reached a new intraday high of $4,216.58. Looking at the trend of spot gold prices yesterday, the overall situation still could not break away from the sideways pattern. However, the support at $4,200 was relatively strong. Even if $4,210 was still taken as the central axis, compared with the beginning of this week, the gold price has clearly shifted from fluctuating below this level to developing above it. Nevertheless, it is obvious that since the beginning of December, the major players seem to have left the market, resulting in a lack of directional guidance for the gold price and causing it to fluctuate repeatedly. $4,195 for strong technical support In the short term, the gold price trend has not changed much. The moving average lines on the hourly chart have lost their reference value, and it is not advisable to overly trust the breakthrough signals of the hourly candlestick chart, as this often leads to buying high and selling low. However, the breakthrough signals on the 5-minute and 1-minute charts can bring profit opportunities. Currently, from the 5-minute chart, $4,195 is a clear technical support level for gold. However, $4,210 was gained and then lost. Within the day, it may return to fluctuate within the range of $4,210 to $4,160. But this is on the premise that the gold price clearly breaks below $4,200. However, I still believe for now that $4,200 is a relatively strong technical support level for gold. Be cautious of false breakthroughs. For short-term rebounds, the first major resistance is $4,218.5. If broken, it is possible to rise further, and the possibility of breaking the high of yesterday cannot be ruled out. The above content is for reference only and does not constitute investment advice.
2025-12-03
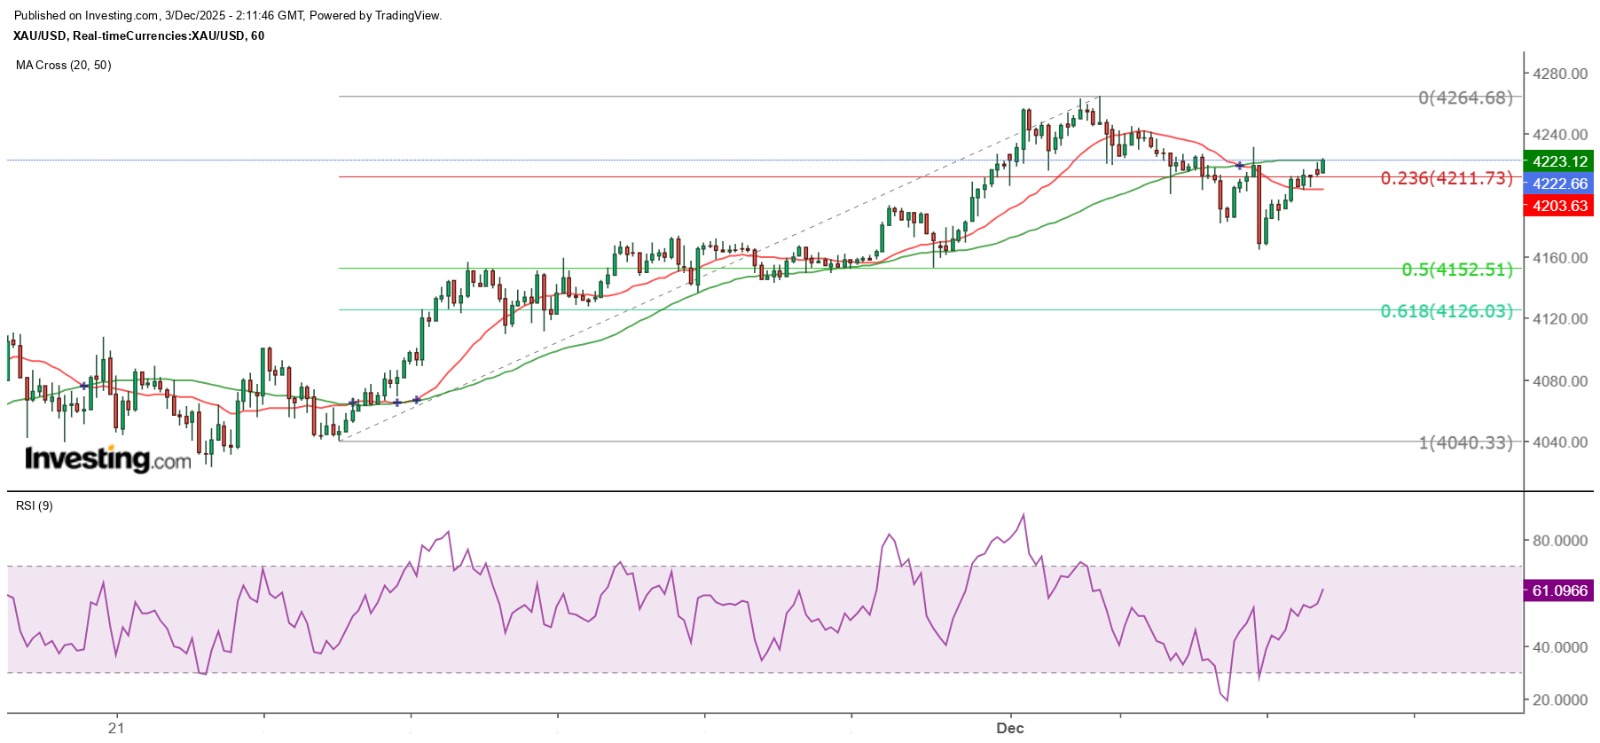
"Gold Price at 4,210 Becomes Key Support and Resistance Level" 3/12/2025 10:11 Finalized Spot gold prices continued to decline after forming a small double top on the hourly chart on Monday. Yesterday, the lowest point reached $4,163.97, still over $11 away from the key support level of $4,152.50 mentioned yesterday. Although the price has been recovering since then and rose to a high of $4,221.07 this morning, it has broken below the 50SMA on the hourly chart ($4,223). This morning's rebound to that level has been met with resistance, and it remains uncertain whether it can break through the large bearish candle formed during yesterday's sharp decline. Of course, from the daily chart perspective, whether it is judged by the candlestick pattern or the arrangement of moving averages, the upward breakout pattern of gold prices has not been disrupted. However, if there is a short-term decline of several tens of dollars, investors cannot ignore it. One of the reasons why many investors suffer losses is that they can tolerate large losses, but the key is whether they should accept such large losses? Being able to accept does not mean it should be done, especially for gold prices. Even if there is a strong one-sided movement of several tens of dollars within a day, it can still be wiped out completely within the same day. Spot gold has not yet adjusted by 50% of its biggest gain since November 24th. This morning's rebound slightly broke through the top of yesterday's big bearish candle, but it has not been confirmed that the top has been broken. There is still a possibility that gold prices will retest $4,152.5. The important Gann angle of $4,210 has once again become a support or may turn into resistance. This is the price at which both bulls and bears are currently fighting. If gold prices clearly break through the 50 SMA on the hourly chart and hold above it, it is expected to fluctuate between $4,210 and $4,260 within the day. If gold prices fall back below $4,210, it is more likely to fluctuate between $4,210 and $4,150. The above content is for reference only and does not constitute investment advice.
2025-12-02
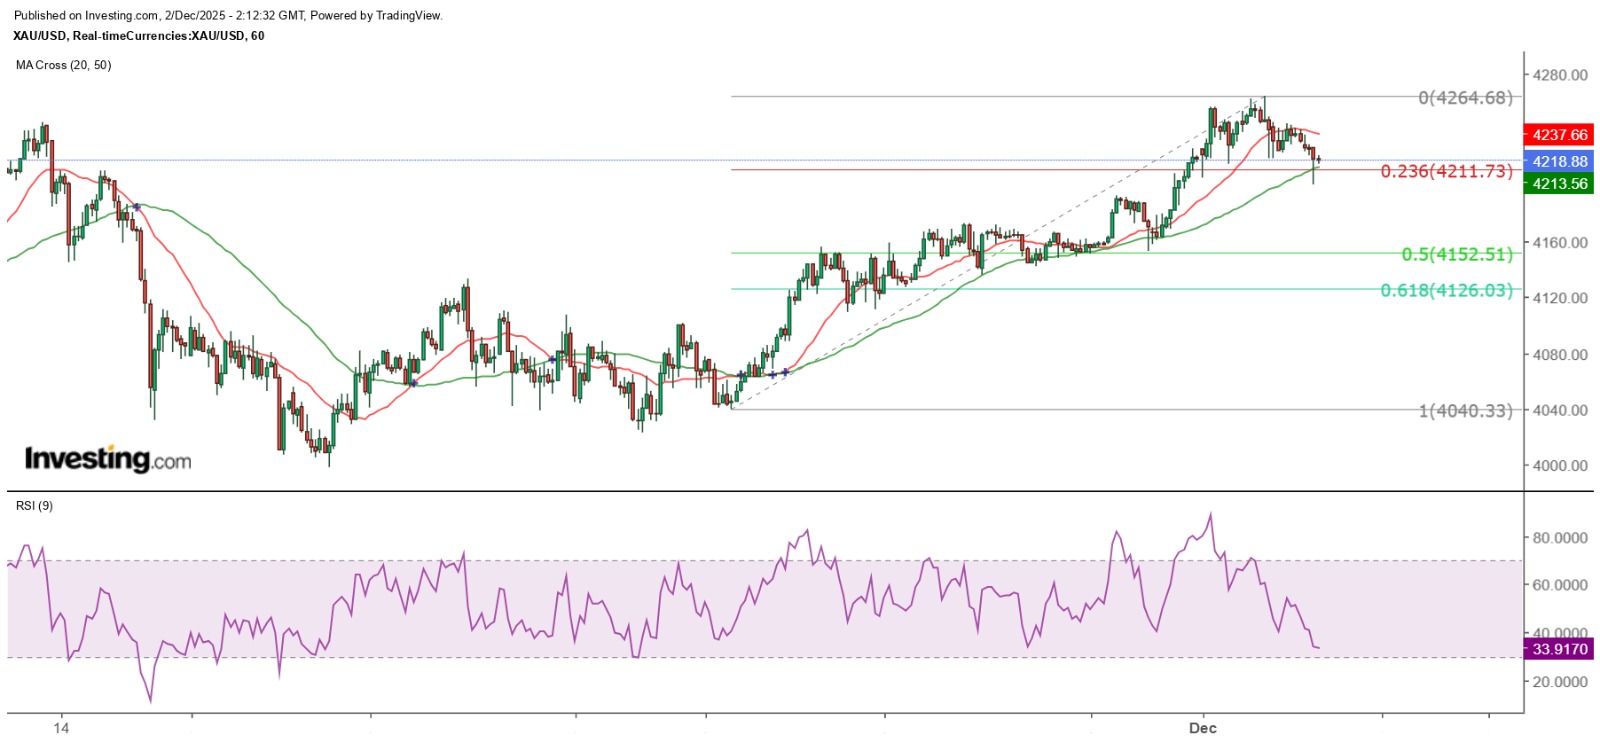
"Gold Price Stabilizes at 4,200, Outlook Positive" 2/12/2025 10:10 Completed Yesterday, the spot gold price rose to $4,264.68 in the early morning in New York but then lost momentum and dropped sharply, hitting a low of $4,219.88 within an hour. It gradually recovered half of its losses but fell again after reaching a high of $4,244.77. Today, it plunged in the early Asian session but managed to hold above $4,200, rebounding from a low of $4,200.75 and remaining above $4,210 for the time being. From the hourly chart, it can be seen that the gold price formed a small double top at the levels of $4,256 and $4,264 yesterday, and it was in a double top divergence with the 9RSI. After breaking below the 20SMA (currently around $4,237.9), multiple rebounds failed to close above this line. This morning, it sharply dropped and tested the 50SMA (currently around $4,212.2). This line has been an important support level for the gold price since the new round of upward trend began on November 24th. Once it is breached, the gold price is expected to adjust 50% of the rise in this period, to around $4,152.5, before it can resume its upward trend. The 50SMA on the hourly chart provides strong support. However, for now, the gold price has neither broken below the 50SMA on the hourly chart nor fallen below $4,200. On the contrary, it has regained its footing at the Gann 180-degree angle support level of $4,210, rebounding to a high of $4,221. However, it is constrained by the pre-fall low of $4,221.76. From a 5-minute perspective, the gold price has encountered resistance twice at $4,221 and $4,219. Nevertheless, as long as it remains above $4,210, the gold price is still likely to fluctuate within the range of $4,210 to $4,260 during the day, preparing for a further challenge of $4,310. As seen from the daily chart, the correction since yesterday in New York is merely a consolidation after gold broke through the downtrend resistance last Friday. It has not changed the breakout pattern of gold. Even if gold erases all of last Friday's gains, as long as it does not close below last Friday's low of $4,157.15, the upward breakout signal remains valid. According to the current development, the chance of challenging the historical high of $4,381 before the end of this year, or even setting a new high, is still extremely high! The above content is for reference only and does not constitute investment advice.
2025-12-01
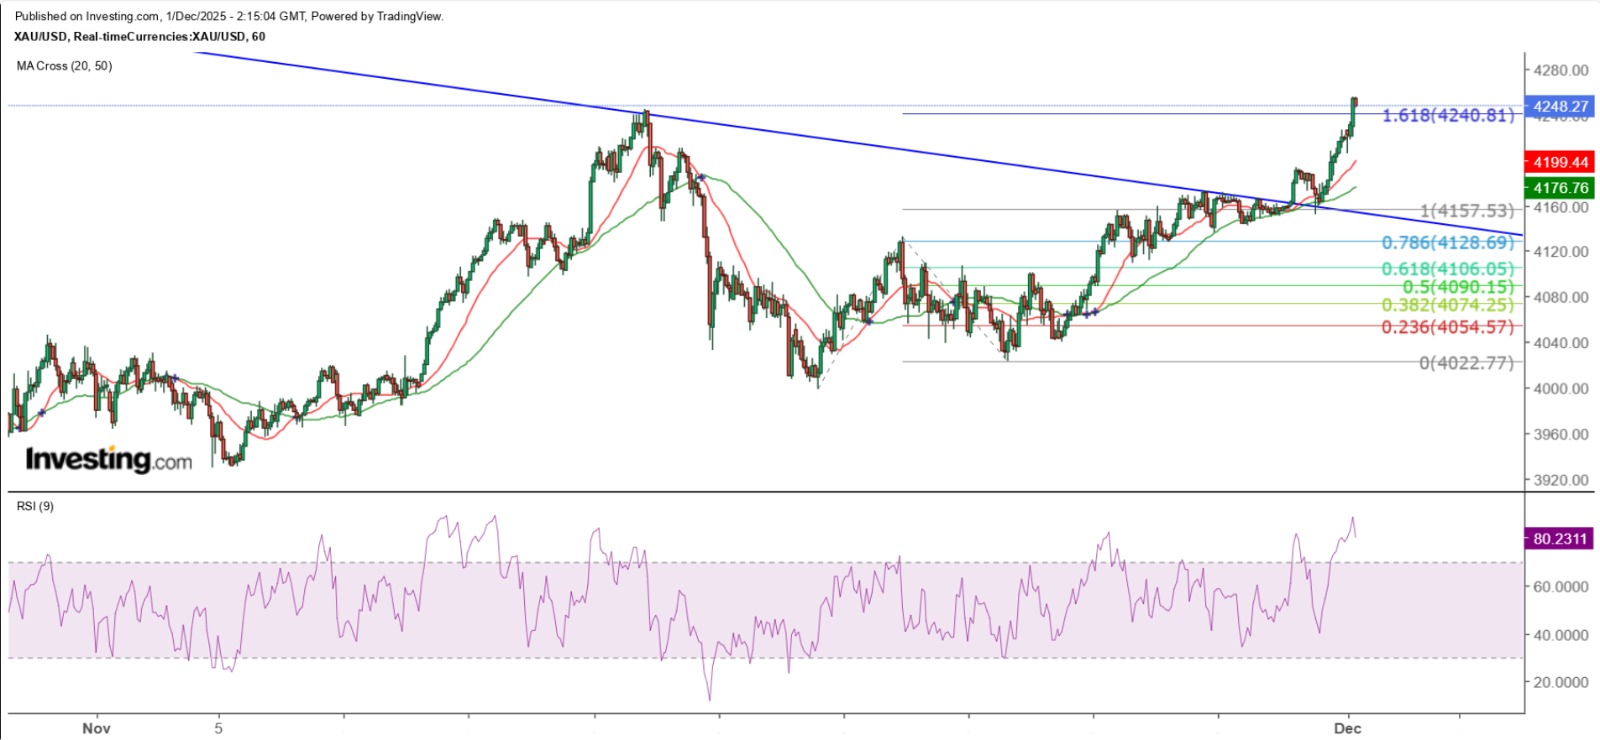
"Gold Price Faces Double-Top Risk but Remains Strong" 1/12/2025 10:09 Finalized Today marks the first trading day of the last month of 2025, and the gold price also witnessed a breakthrough trend after last week's Thanksgiving. The spot gold price broke through the lower trend line of the narrowing triangle on the daily chart last Friday. However, before the Tokyo midday session and the opening of the European market, the gold price exhibited extremely abnormal behavior, plunging by tens of dollars within one or two seconds. This situation became even more frequent as the European midday session approached. CME later issued a notice stating that due to a cooling problem at the CyrusOne data center, CME had suspended market operations. This is the fourth time that CME has failed to quote due to different reasons, causing market chaos. This is one of the risks faced by investors operating international trading products. $4,210 becomes the key support level. Spot gold prices broke through the 4210-dollar Gann 180-degree angle as expected. This level has now become the main support. This morning, it continued to reach a new high of 4252 dollars, just as I pointed out last Friday - challenging the high of 4245 dollars made on November 13th. Therefore, in the short term, we need to pay attention to whether a double top will form. However, the gold price trend is once again on the rise, and the 50SMA on the 5-minute chart (4236) is also clearly providing support. Given the current strong momentum of the gold price, unless there is a strong reversal signal, such as a double-line reversal or a piercing pattern, it is not advisable to take any short selling actions rashly. From Gann's perspective, the next target for spot gold prices to challenge will be $4,310, with a possible brief resistance at $4,260. Observing the hourly chart, if the movement since November 18th is regarded as waves 1, 2, and 3, the current gold price has reached the basic target of wave 3's rise ($4,240.81). There is indeed a risk of a brief adjustment, but it is expected that $4,236 will be the first significant support level, followed by $4,227, with $4,210 being the last line of defense. Investors planning to short sell should be aware that the gold price could rebound rapidly after approaching or breaking through these two levels. The above content is for reference only and does not constitute investment advice.
2025-11-28
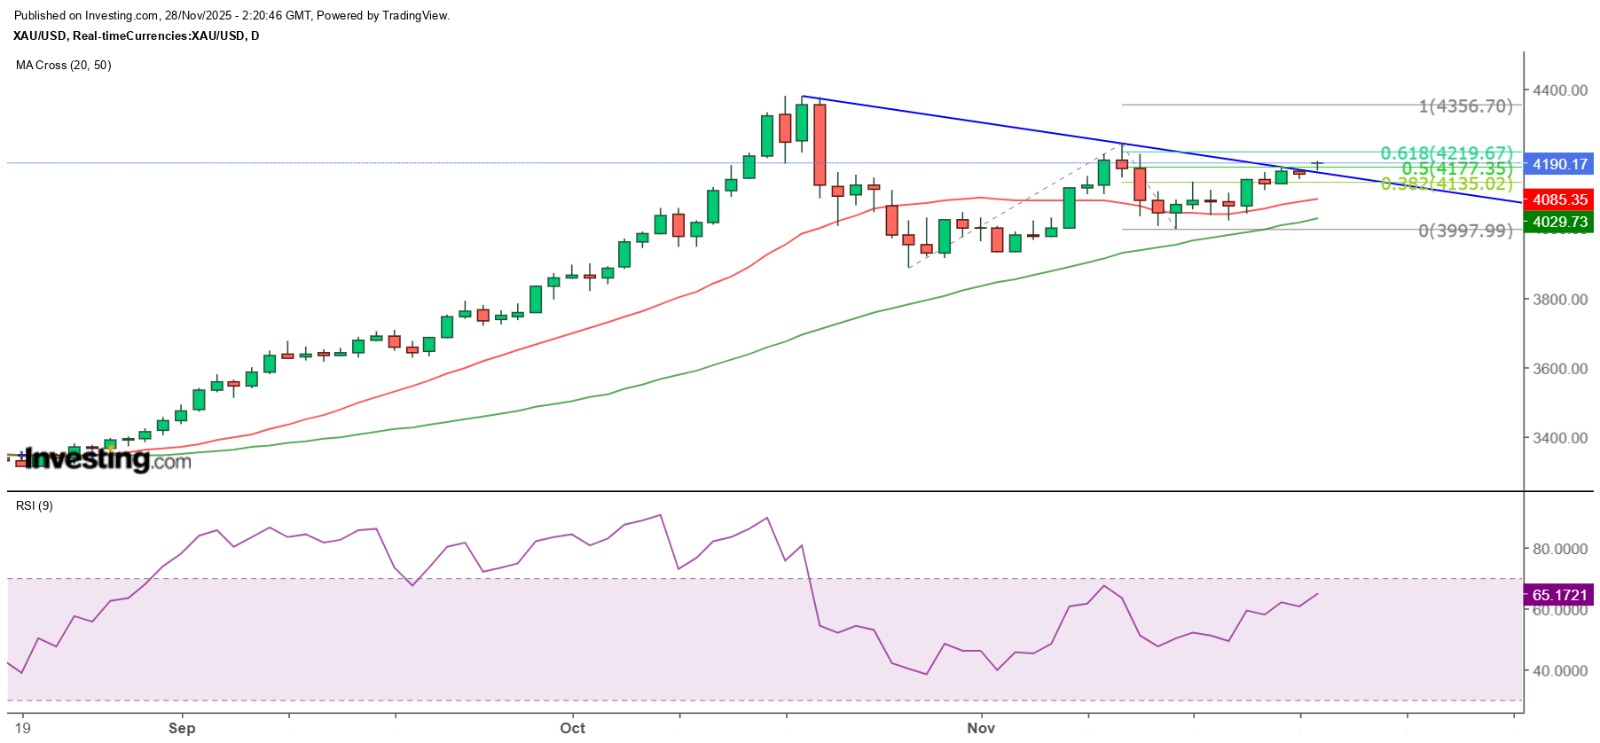
"Gold Prices Aim to Challenge Historical Highs" 28/11/2025 10:16 Finalized Gold prices rose strongly in the Asian market this morning, explaining the recent unusually volatile movements - the ups and downs before a major breakthrough. This morning, the spot gold price opened slightly higher at $4,160 and continued to rise, indicating that this is not a strong resistance level but an important short-term support level. From the hourly chart, gold prices have shown a clear narrowing triangle since the opening of the New York market on Wednesday until the sharp upward break this morning, reflecting that both bulls and bears have entered a close combat zone. Of course, the bulls are clearly the dominant force, and the narrowing triangle is likely just a reflection of the bulls accumulating strength before further pushing up the gold price. Gold prices broke above the descending trend line of the triangle. This morning, the highest price of gold was temporarily seen at $4,193.07. However, the current cumulative increase is approximately $35, indicating a high possibility that gold will challenge $4,210. There is even a chance that it could reach the high of $4,245 set on November 13. From the daily chart, gold has broken through the descending trend line of the narrowing triangle. If there is no double-day reversal or strong bearish signal such as a bearish engulfing pattern in the next one to two trading days, gold is expected to consolidate above $4,200 and then challenge $4,245. Moreover, it is unknown whether any investors have noticed that the current spot gold price has broken through the double top neckline of $4,186 formed on the hourly chart before the sharp decline on October 21. This level is also expected to become an important support level in the short term. A return above this level may indicate that gold is determined to challenge its historical high, with the main driving force being the market's renewed belief that the probability of the Federal Reserve cutting interest rates in December has increased. $4,160 becomes a key short-term support level. In other words, the recent strength in gold prices is a pre-emptive response to the interest rate cut. Therefore, whether the gold price fails or succeeds in challenging the historical high, there is a possibility that a major double top will form around $4,400 and then fall back. However, this will depend on the Federal Reserve's assessment of the US economic performance and inflation development in the coming year. Additionally, Powell will step down in May next year, and a dovish candidate is expected to take over as the chairperson. The market has doubts about the independence of the Federal Reserve, and how this will be reflected in the gold price is another story. After touching $4,193.7, gold prices quickly retreated but still remained above the 20SMA on the 5-minute chart ($4,187). If it breaks below this level, the 50SMA ($4,172.5) is expected to offer stronger support. Therefore, it is believed that $4,160 has become the intraday bottom for gold prices, and the top of the sideways range since Wednesday ($4,173.26) is also a strong support level. The above content is for reference only and does not constitute investment advice.
2025-11-27
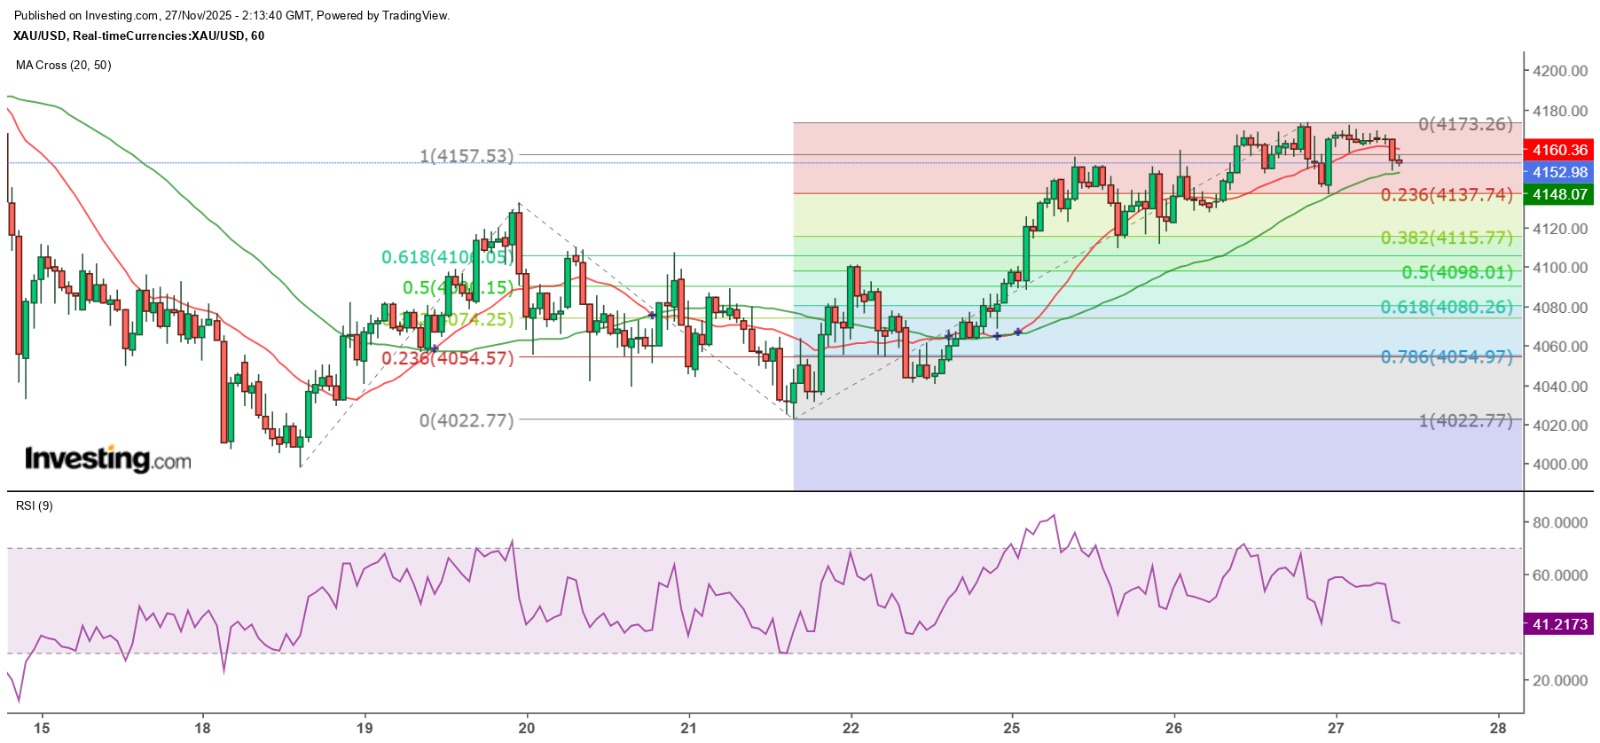
Gold prices are expected to fluctuate within a narrow range on the day. 27/11/2025 10:08 Finalized. Yesterday, the gold price was extremely volatile. From the Asian session to the close of the London market, it first rose and then fell. It reached a new daily high of $4,173.26, then plunged sharply to a low of $4,136.72 before climbing again. However, the highest it reached was $4,171.76, after which it entered a sideways consolidation. This morning, in the early Asian session, it broke below the New York midday low of $4,158.05, hitting a low of $4,148.99 before rebounding. It is currently fluctuating in a narrow range around $4,150. $4,170 is the double top resistance. Judging from the hourly chart, the gold price has formed a double top pattern above $4,170. The neckline support can be regarded as $4,136.72. The rebound high this morning at $4,156.49 is only about $1.5 away from the low of yesterday's New York midday session at $4,158.05. However, it has not been able to break through this level and has turned downward again, indicating that $4,158.05 or $4,160 (one of the Gann Square levels) is the intraday resistance, but not a strong one. If $4,158.05 is considered as another double top neckline, then the first intraday support level for the gold price would be $4,144.34, and $4,136.72 would be an important support. The 50-hour SMA must not be violated. Gold prices exhibited unusually volatile performance yesterday, which may be related to the approaching Thanksgiving holiday. The key level to watch for now remains the previous horizontal resistance zone top at $4,132.89 on the hourly chart, which is considered a crucial support for this uptrend. If this level is breached, gold prices are likely to return to the range of $4,000 to $4,100, seeking a new breakthrough. Looking at the hourly chart again, gold prices have fallen below the 20SMA ($4,160.83), but still hold above the 50SMA ($4,147.8). If gold prices fall below the 50SMA and fail to rebound above it, there is a tendency for further adjustment within the day, with the aforementioned price range serving as support. Gold prices are expected to fluctuate mostly between $4,135 and $3,175 within the day, and the possibility of a strong trend market is not high. The above content is for reference only and does not constitute investment advice.
2025-11-26
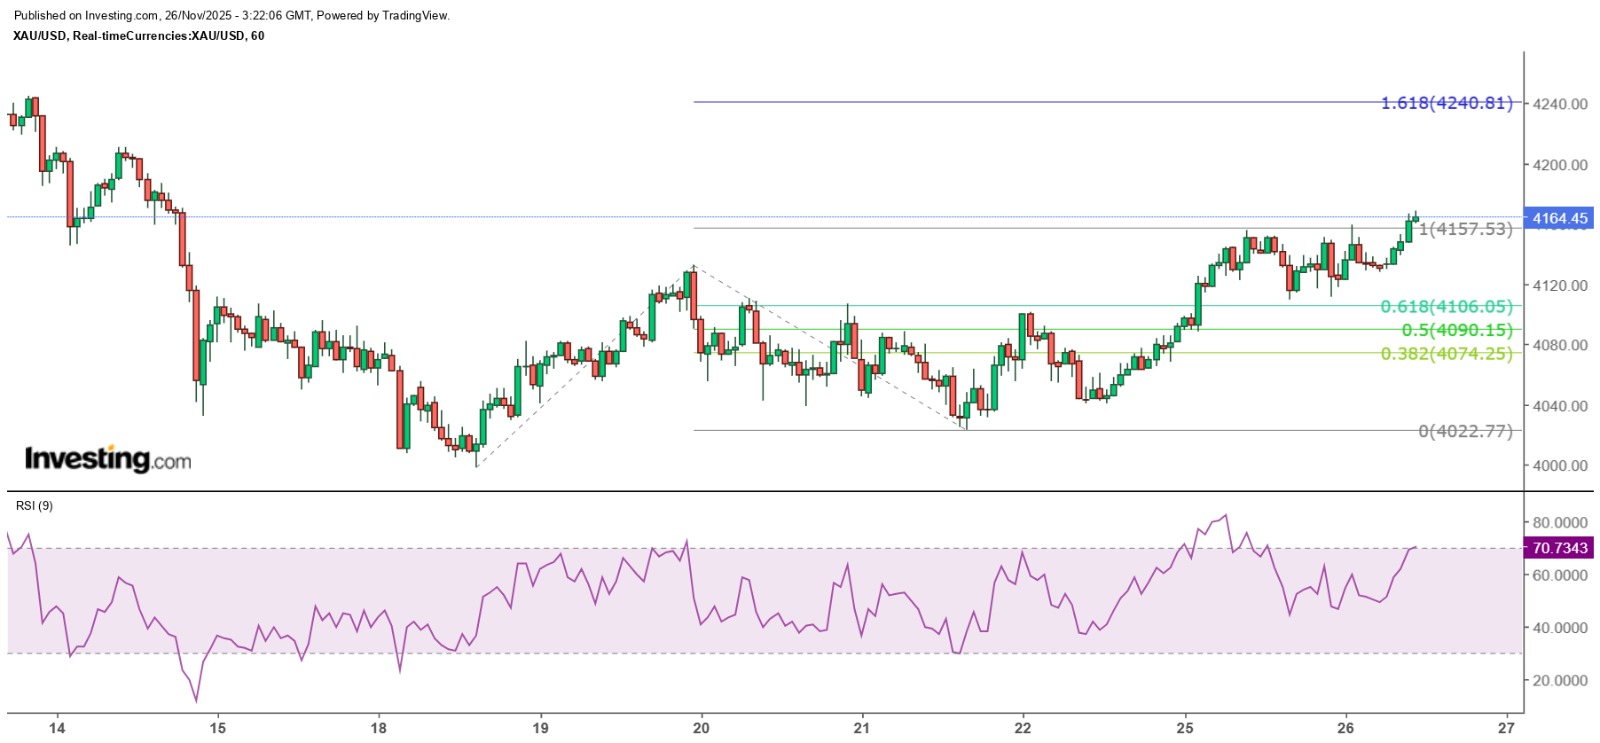
"Gold Prices Reach New Highs, Rekindling Hope" 26/11/2025 11:19 Finalized Gold prices retreated to $4,109.6 yesterday before resuming their upward trend, which was largely in line with the prediction that support would be found at $4,110. This morning in the Asian market, they broke through the $4,162.94 level, which was regarded as the target for the third wave of the upward trend since November 21st, as well as the 100% Fibonacci extension level measured from November 18th. The price reached as high as $4,168.7 this morning. The Federal Reserve is expected to be led by a dovish successor. One of the reasons for the upward break of gold prices is the growing expectation that the Federal Reserve will cut interest rates by 25 basis points in December. In addition, Kevin Hassett, the director of the White House Council of Economic Advisers, is seen as the most likely candidate to succeed Powell, who will step down in May next year. He has also stated that if he has the opportunity to serve as the chair of the Federal Reserve, he hopes to cut interest rates significantly. This news has given a boost to the gold price, which has been lacking direction recently. The target for the third wave's upward movement points to 4240. If we take November 18th as the starting point of the higher-level wave 1 and November 21st's low of $4,022.77 as the end of wave 2, and calculate the target of wave 3's rise as 1.618 times the length of wave 1, then the gold price could rise to $4,240. Regardless, $4,110 clearly becomes the key medium-term support level for the gold price, and the possibility of it falling below $4,000 has significantly decreased. If the gold price can rise to $4,240, it will have broken through the important resistance level of $4,210 at the 180-degree angle of Gann, thus paving the way for the gold price to move towards $4,310 and even break through $4,381 to reach a new high! The above content is for reference only and does not constitute investment advice.
2025-11-25
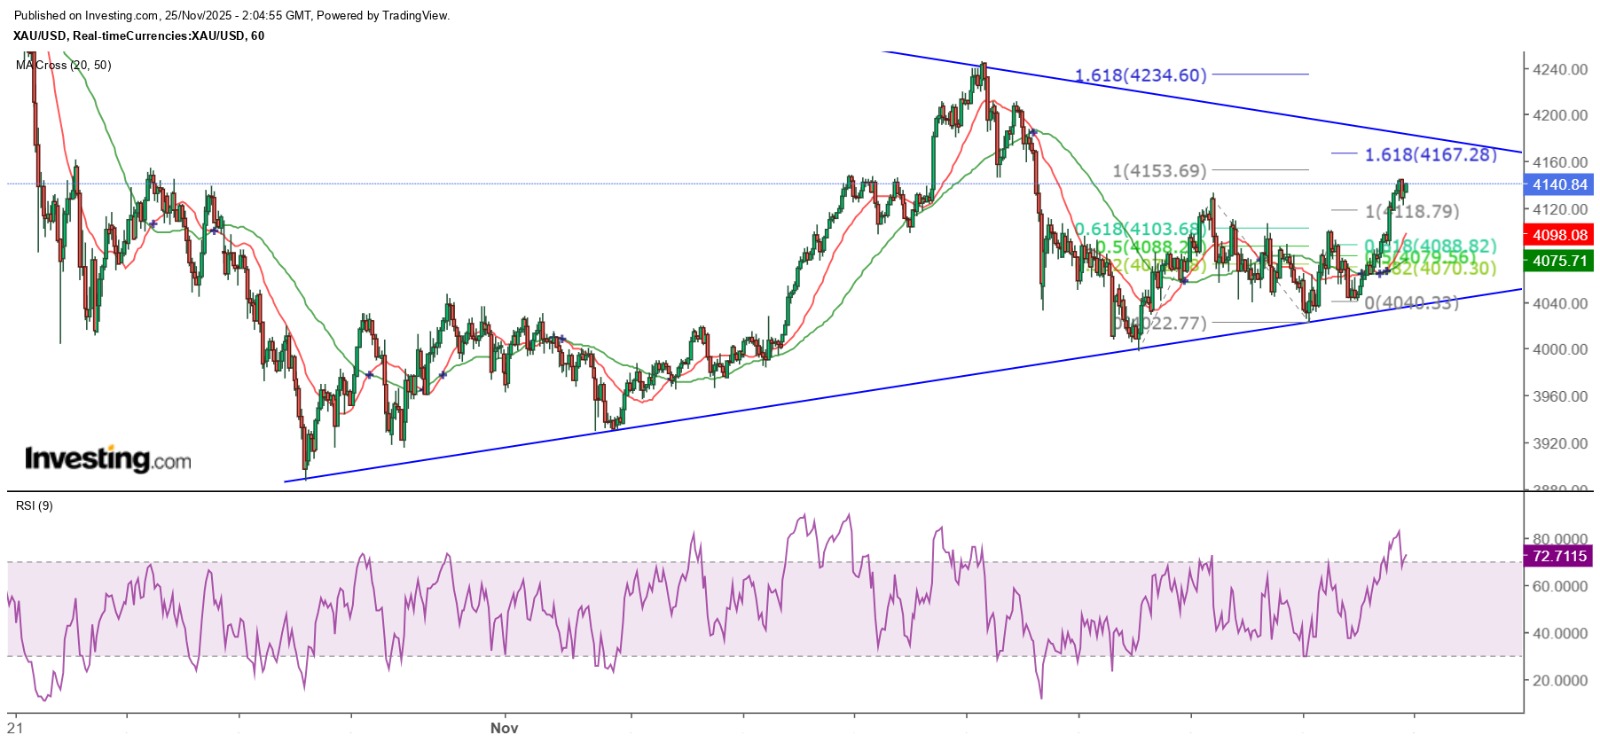
"Gold Prices Break Out of Sideways Range and Continue to Strengthen" 25/11/2025 10:03 Finalized New York Fed President Williams currently stated that monetary policy is moderately tight and hinted at the possibility of a rate cut in December. The probability of a rate cut next month, as reflected in interest rate futures, has risen from 44.4% to 70%. After stabilizing above the 20-day SMA (currently around 4057) for several consecutive days, spot gold prices rebounded sharply. Yesterday, the daily range exceeded 100 dollars, with the high and low points being 4140.13 and 4040.03 dollars respectively. Even so, gold prices remain within a narrowing triangle on the daily chart. A break above 4245.2 dollars would be regarded as a breakout signal to the upside. Williams hints at another rate cut Investors should note that $4,110 is at the 90-degree angle of Gann. After the gold price has been consolidating sideways for several days, it has broken through this level. The probability of it returning below $4,110 in the short term has decreased. On the contrary, the possibility of it further challenging $4,160 and even another important resistance level of $4,210 has increased. The resistance at $4,110 turns into support. From the hourly chart, the gold price has formed an upward trend since October 28th, and the trend line has obvious support. Yesterday, the gold price broke through the resistance level of $4,132.89 formed since November 14th. This morning, it only rose a few dollars, indicating that there is still a considerable upward space in the short term. If the movement since November 21st is regarded as waves 1, 2, and 3, and the amplitude of wave 3 is 1.618 times that of wave 1, then the gold price will have the opportunity to correct only when it reaches $4,167.28, while $4,118.79 is the support level. If the Fibonacci extension line is used to measure the trend since November 18th, when the extension reaches 100%, the gold price could reach $4,153.69. In other words, even if the gold price holds above $4,132.89 or $4,110 on a daily basis, there is still expected to be some resistance at $4,153.69 and $4,167.28. Of course, if the market is determined to break through the resistance of the descending triangle, these resistance levels could be easily overcome. The above content is for reference only and does not constitute investment advice.
2025-11-24
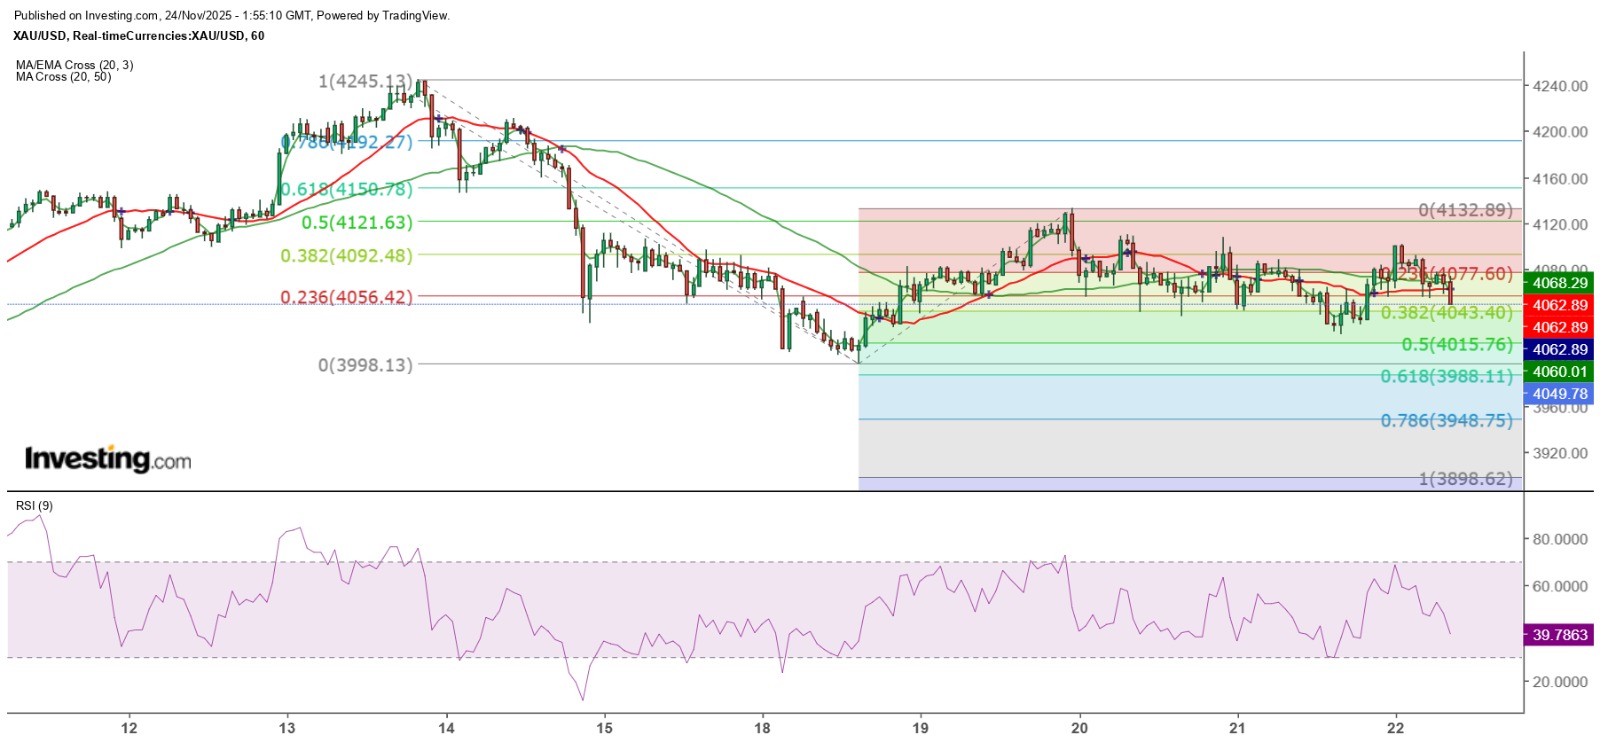
"Gold Price Short-Term Trend Lacks Direction and Is Weak" 24/11/2025 9:54 Completed As the US Department of Labor has announced that due to the shutdown, the October non-farm payroll report and CPI will never be released, and the November CPI will not have monthly change data either, the November non-farm payroll report will be delayed until December 16. As the next Federal Reserve interest rate meeting will be held on December 9 and 10, it is almost certain that the Federal Reserve will not cut interest rates at the next meeting. Therefore, it is believed that the gold price will remain sideways before the Federal Reserve's interest rate decision. Any rise or fall in the gold price caused by news or data other than interest rates and inflation will only be regarded as short-term impacts. Of course, I still believe that the adjustment of the gold price has not yet ended. The daily chart still shows a narrowing triangle. The current gold price remains within the range of $4,010 to $4,110. Looking at the daily chart, the highs and lows of the gold price over the past three trading days have both shifted lower. Last Thursday and Friday, it also briefly fell below the 20-day SMA (currently around $4,044.4). After opening nearly $10 higher this morning, it reached a high of $4,076.17 before retreating. It is currently supported at the psychological level of $4,050, but the 20-day SMA continues to be challenged. The overall trend of the gold price on the daily chart still shows a narrowing triangle. To turn upward, it must break through $4,245.2. If it falls below $3,886.49, it will form a downward channel pattern, further confirming a downward trend. From the hourly chart, the gold price has been roughly in a sideways pattern since the sharp drop on November 14th, with the main fluctuation range between 4110 and 4030 US dollars. However, it should be noted that after reaching a high of 4132.89 US dollars at 11 p.m. last Wednesday, the gold price closed in a bearish engulfing pattern. Since then, it has not touched that level again, and since the London close last Friday, it has twice shown a descending flag pattern. The intraday trend has been weak for the most part. It is expected that the gold price will still be centered around 4060 US dollars intraday, fluctuating between 4110 and 4010 US dollars. The above content is for reference only and does not constitute investment advice.
2025-11-21
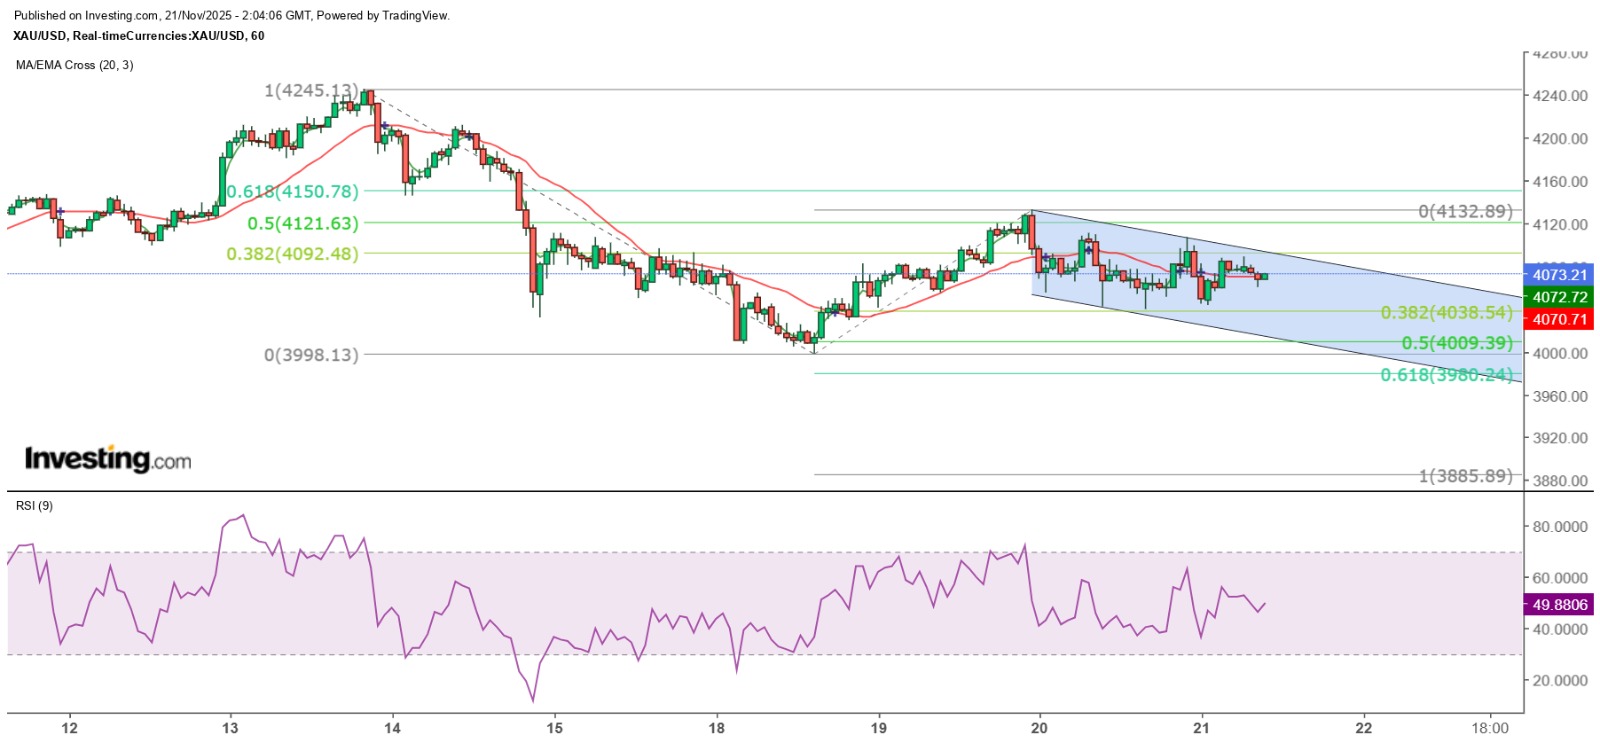
"Gold Price Trapped in $100 Volatility Range in the Short Term" 21/11/2025 10:01 Finalized Yesterday, the gold price reached a high of $4,110.16 in the Asian market. However, it failed to rise above $4,110 for the rest of the day as expected. What was somewhat surprising was that the September non-farm payroll report, which was delayed by more than a month, showed that the overall non-farm payroll increased by 119,000 in September, more than twice the expected figure and the first time it exceeded 100,000 since June. Excluding the 22,000 new government jobs, private enterprises added 97,000 jobs, also more than the expected 62,000 and the most since June. The unemployment rate rose slightly by 0.1 percentage point to 4.4%. Gold has not played its role as a safe-haven asset. The employment report dashed market expectations of a rate cut by the Federal Reserve in December. However, the three major U.S. stock indexes initially rose sharply, seemingly reflecting that the data alleviated concerns about a possible U.S. economic recession. But near the New York midday session, the stock indexes turned sharply lower and closed lower for the day. The Nasdaq dropped 2.15%, the S&P 500 fell 1.55%, and the Dow Jones also declined 0.84%. However, gold failed to play its safe-haven role. Although the spot gold price plunged to $4,046.85 after the release of the non-farm payroll report, it then rebounded significantly, reaching a high of $4,107.29, but it did not challenge the intraday high set in the Asian session. It then fluctuated and fell, hitting a low of $4,043.86 after the London close before climbing again. However, it was clearly blocked at a high of $4,087.14 and then remained in a sideways state. This morning, it rose to $4,088.72 before falling again and continuously hitting new intraday lows to $4,060.66. First, a simple Gann angle analysis shows that if gold can hold steady at $4,060, it is expected to fluctuate within the range of $4,060 to $4,110. However, $4,110 has clearly been breached, and the range of fluctuation has been compressed. Gold is very likely to return to fluctuating within the range of $4,010 to $4,060, indicating that the $4,000 mark is likely to be tested again. From the hourly chart, if the Fibonacci extension line is used to measure, from the high on November 19th, if the extension decline reaches 100%, it will be at $3,885.89; if the decline is 50%, it will be at $4,009.39; if the decline is 61.8%, it will be at $3,980.24. Among the three decline targets, the 50% target is closest to the Gann 90-degree vertical angle of $4,010, which is the most significant support level. The $4,000 mark must not be lost. However, apart from the unfavorable outlook for the US dollar interest rate on gold prices, the Thanksgiving holiday in the US is approaching, and investors will surely pay attention to the related retail sales situation. The good or bad performance is believed to become an excuse for the market to hype again whether the Federal Reserve will cut interest rates in December. In the short term, gold prices lack significant upward incentives, so at most they will fluctuate within a relatively wide range of $4,010 to $4,110. However, if the $4,000 mark is breached, it could very well be the beginning of a new round of decline! The above content is for reference only and does not constitute investment advice.
2025-11-20
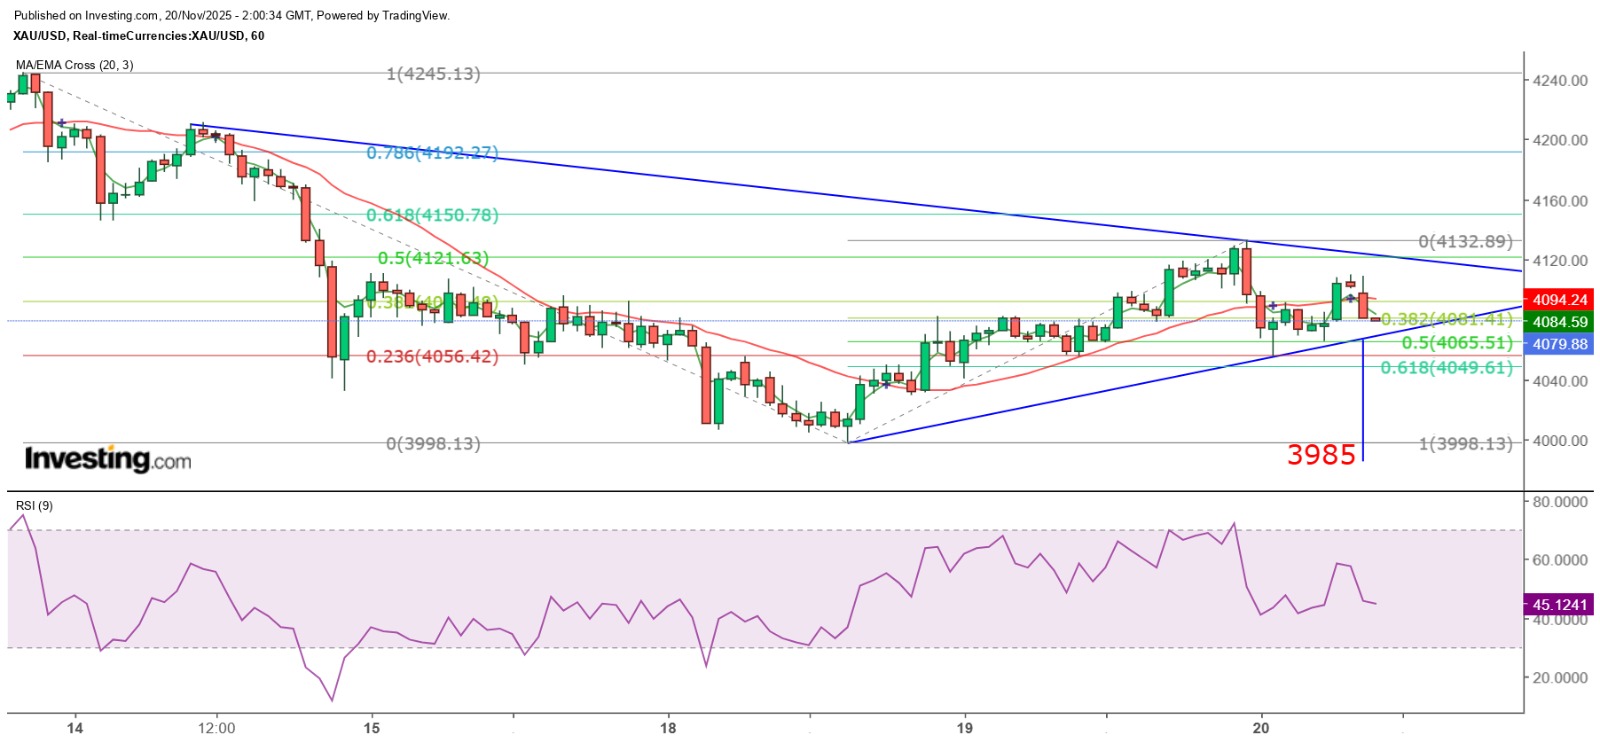
"Gold Price at $4,110 Likely to Be the Intraday High" 20/11/2025 9:59 Completed Yesterday, the spot gold price hit a low of $4,055.75 in the early Asian session and then continued to strengthen. It reached a high of $4,132.89 near the midday of the New York session before peaking and falling back. From the hourly chart, the gold price mostly remained above the 20SMA (currently around $4,095.7) and continued to climb. However, after touching the daily high of $4,132.89, it formed a bearish engulfing pattern, indicating a short-term peak at that level. Subsequently, it fluctuated and declined, hitting a low of $4,055.58 before rebounding again. The maximum decline was slightly less than 50% of the largest increase since November 18. This morning, the gold price rebounded to $4,110.16 before falling back and is currently hovering below $4,100. Views on interest rates among Fed board members are sharply divided. Gold prices rebounded after the New York midday session yesterday, likely in response to the release of the minutes of the Federal Reserve's October interest rate meeting. The minutes revealed significant differences among FOMC members on interest rate decisions. While many participants supported a rate cut, some of those in favor also accepted keeping rates unchanged. Several members opposed a rate cut, expressing concerns over the stagnation in the progress towards the 2% inflation target and warning that if inflation fails to return to 2% in a timely manner, long-term inflation expectations could rise. In addition, most committee members pointed out that further lowering the policy interest rate might heighten the risk of persistently high inflation or be misinterpreted by the market as a lack of firm commitment by policymakers to achieve the 2% inflation target. The meeting minutes further reduced the probability of a rate cut in December by the Federal Reserve. According to CME's interest rate futures, the probability of a rate cut has dropped to 32.8%. Additionally, investors should note that the Bureau of Labor Statistics announced it will not release the October non-farm payroll report and will instead publish the November non-farm payroll report on December 16. $4,000 remains the target for the assault. As such, the non-farm payroll report to be released by the US Department of Labor tonight is unlikely to boost the gold price. In terms of technical trends, the high of $4,110.16 this morning is exactly the strong resistance at the 90-degree angle of Gann's theory. Therefore, it is judged that the top of the gold price has already emerged today. As a result, the gold price is expected to fluctuate between $4,110 and $4,060 within the day. However, the two recent significant rebounds have both reached lower highs. Measured by the TD line, if the gold price breaks through the ascending track, the target for the decline is $3,985, indicating a high probability that the gold price will fall below the $4,000 mark again. The above content is for reference only and does not constitute investment advice.
2025-11-19
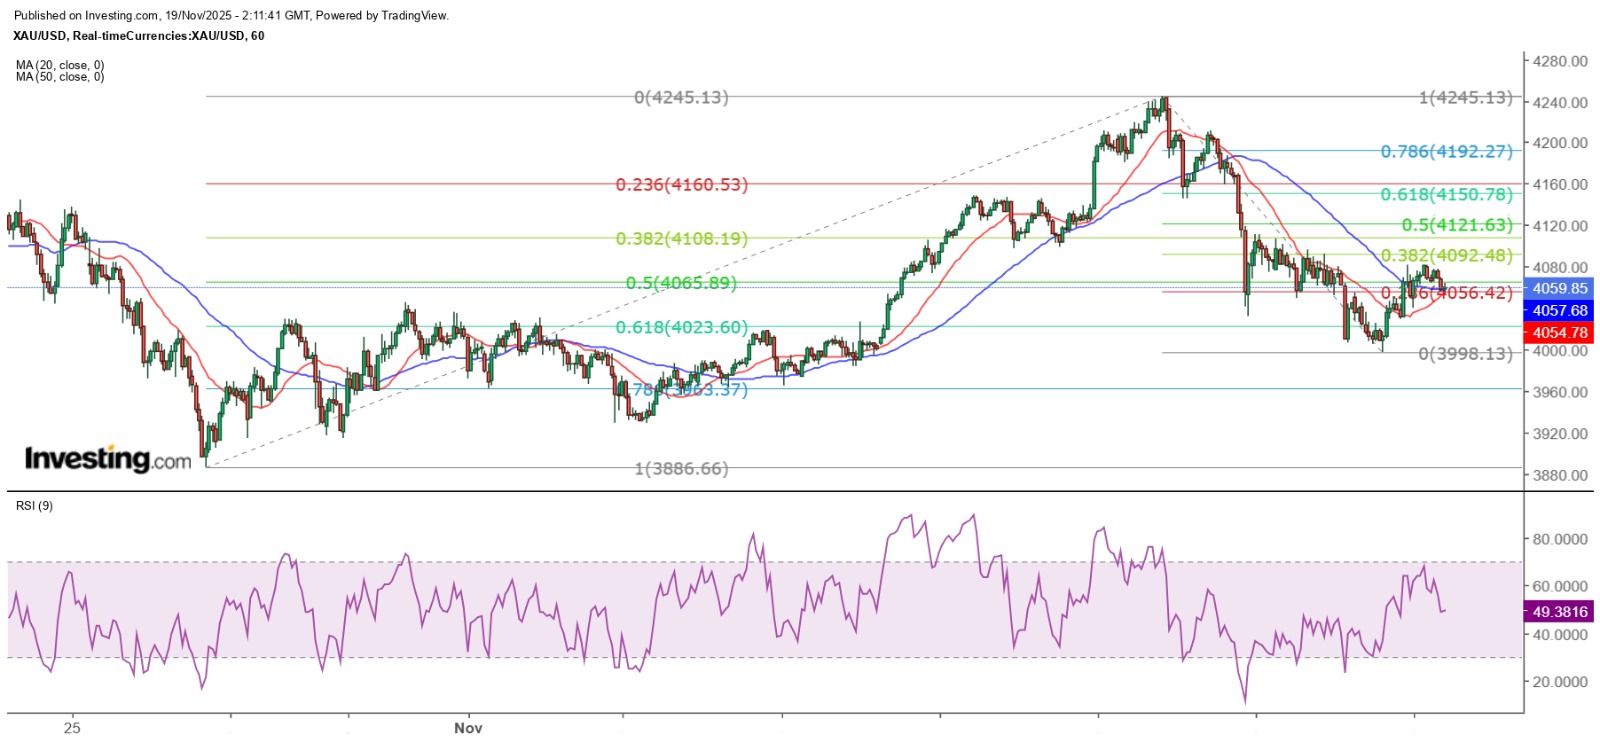
《金价或在四千美元短线触底》19/11/2025 10:11 完稿 昨天现货金价虽一如预期跌穿4000美元关口,但完全缺乏11月上旬大跌的气势,低位仅见3998.13美元即鸣金收兵,其后更节节上升,不但重上4060美元,更一度升破4080美元,在纽约市尾段高见4082.24美元才再度回落。 从小时图所见,金价不但重返20SMA(4052.9)以上,更是自11月14日大跌以来首次重上50SMA(4058),但由低位累计的反弹幅度,仍未及11月13日以来最大跌幅的38.2%。暂时判断,或许是因为美国政府部门全面重新运作,经济数据如常公布,金价借着不利的数据制造波幅而已。现时美国已采用冬令时间,重要数据在晚上9时30分公布,昨天ADP公布截至11月1日止的一周私营企业的就业职位变动,结果是减少2500个职位,金价借势反弹,而其后美国公布极为滞后的8月耐用品订单,则稍令金价回调。 若然ADP公布每周就业变动成为常态,将令金价未来更加波动。明天美国公布9月非农就业报告,投资者需求注意,ADP公布的9月私营企业职位增加4.2万个,照理官方公布的数据亦应为正数,金价仍将面对下跌风险,昨天跌穿4000美元是否预演? 金价短线或有转升讯号 今早金价冲高至4078.26美元后持续回落,并再度跌穿4060美元,5分钟图构成小双顶形态,短线有机会跌穿4048美元。但要留意,小时图20SMA正向上与50SMA会合,一旦上破50SMA,则构成买入讯号,预示金价短期很可能已在4000美元触底,并展开新一轮反弹浪。金价仍未守稳4060美元,预料日内在4035至4085美元上落的机会较大。金价能否展开反弹浪,还看明天美国公布9月就业报告及金价的反应。 以上内容仅供参考,不构成投资建议。


